
Understandable Statistics: Concepts and Methods
12th Edition
ISBN: 9781337119917
Author: Charles Henry Brase, Corrinne Pellillo Brase
Publisher: Cengage Learning
expand_more
expand_more
format_list_bulleted
Concept explainers
Videos
Textbook Question
Chapter 1.3, Problem 11P
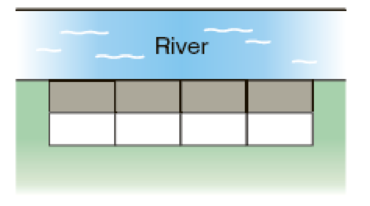
Critical Thinking An agricultural study is comparing the harvest volume of two types of barley. The site for the experiment is bordered by a river. The field is divided into eight plots of approximately the same size. The experiment calls for the plots to be blocked into four plots per block. Then, two plots of each block will be randomly assigned to one of the two barley types.
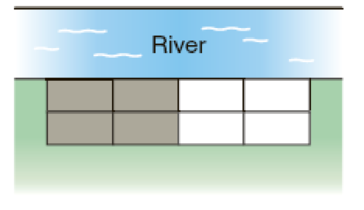
Two blocking schemes are shown below, with one block indicated by the white region and the other by the gray region. Which blocking scheme, A or B, would be better? Explain.
Scheme A
Scheme B
Expert Solution & Answer

Trending nowThis is a popular solution!

Students have asked these similar questions
I need help with this problem and an explanation of the solution for the image described below. (Statistics: Engineering Probabilities)
I need help with this problem and an explanation of the solution for the image described below. (Statistics: Engineering Probabilities)
DATA TABLE VALUES
Meal Price ($)
22.78
31.90
33.89
22.77
18.04
23.29
35.28
42.38
36.88
38.55
41.68
25.73
34.19
31.75
25.24
26.32
19.57
36.57
32.97
36.83
30.17
37.29
25.37
24.71
28.79
32.83
43.00
35.23
34.76
33.06
27.73
31.89
38.47
39.42
40.72
43.92
36.51
45.25
33.51
29.17
30.54
26.74
37.93
Chapter 1 Solutions
Understandable Statistics: Concepts and Methods
Ch. 1.1 - Statistical Literacy In a statistical study what...Ch. 1.1 - Statistical Literacy Are data at the nominal level...Ch. 1.1 - Statistical Literacy What is the difference...Ch. 1.1 - Statistical Literacy For a set population, does a...Ch. 1.1 - Critical Thinking Numbers are often assigned to...Ch. 1.1 - Interpretation Lucy conducted a survey asking some...Ch. 1.1 - Marketing: Fast Food A national survey asked 1261...Ch. 1.1 - Advertising: Auto Mileage What is the average...Ch. 1.1 - Ecology: Wetlands Government agencies carefully...Ch. 1.1 - Archaeology: Ireland The archaeological site of...
Ch. 1.1 - Student Life: Levels of Measurement Categorize...Ch. 1.1 - Business: Levels of Measurement Categorize these...Ch. 1.1 - Fishing: Levels of Measurement Categorize these...Ch. 1.1 - Education: Teacher Evaluation If you were going to...Ch. 1.1 - Critical Thinking You are interested in the...Ch. 1.2 - Statistical Literacy Explain the difference...Ch. 1.2 - Statistical Literacy Explain the difference...Ch. 1.2 - Statistical Literacy Marcie conducted a study of...Ch. 1.2 - Statistical Literacy A random sample of students...Ch. 1.2 - Interpretation In a random sample of 50 students...Ch. 1.2 - Interpretation A campus performance series...Ch. 1.2 - Critical Thinking Greg took a random sample of...Ch. 1.2 - Critical Thinking Consider the students in your...Ch. 1.2 - Critical Thinking Suppose you are assigned the...Ch. 1.2 - Critical Thinking In each of the following...Ch. 1.2 - Sampling: Random Use a random-number table to...Ch. 1.2 - Prob. 12PCh. 1.2 - Sampling: Random Use a random-number table to...Ch. 1.2 - Prob. 14PCh. 1.2 - Computer Simulation: Roll of a Die A die is a cube...Ch. 1.2 - Education: Test Construction Professor Gill is...Ch. 1.2 - Education: Test Construction Professor Gill uses...Ch. 1.2 - Sampling Methods: Benefits Package An important...Ch. 1.2 - Sampling Methods: Health Care Modern Managed...Ch. 1.3 - Statistical Literacy A study of college graduates...Ch. 1.3 - Statistical Literacy Consider a completely...Ch. 1.3 - Critical Thinking A brief survey regarding...Ch. 1.3 - Critical Thinking A randomized block design was...Ch. 1.3 - Interpretation Zane is examining two studies...Ch. 1.3 - Interpretation Suppose you are looking at the 2006...Ch. 1.3 - Ecology: Gathering Data Which technique for...Ch. 1.3 - General: Gathering Data Which technique for...Ch. 1.3 - General: Completely Randomized Experiment How...Ch. 1.3 - Surveys: Manipulation The New York Times did a...Ch. 1.3 - Critical Thinking An agricultural study is...Ch. 1 - Critical Thinking Sudoku is a puzzle consisting of...Ch. 1 - Prob. 2CRPCh. 1 - Statistical Literacy You are conducting a study of...Ch. 1 - Prob. 4CRPCh. 1 - Prob. 5CRPCh. 1 - General: Type of Sampling Categorize the type of...Ch. 1 - Prob. 7CRPCh. 1 - General: Experiment How would you use a completely...Ch. 1 - Prob. 11CRPCh. 1 - Prob. 2DHCh. 1 - Prob. 1LCCh. 1 - Discuss each of the following topics in class or...Ch. 1 - Prob. 1UTCh. 1 - Prob. 2UT
Knowledge Booster


Learn more about
Need a deep-dive on the concept behind this application? Look no further. Learn more about this topic, statistics and related others by exploring similar questions and additional content below.Similar questions
- I need help with this problem and an explanation of the solution for the image described below. (Statistics: Engineering Probabilities)arrow_forwardSales personnel for Skillings Distributors submit weekly reports listing the customer contacts made during the week. A sample of 65 weekly reports showed a sample mean of 19.5 customer contacts per week. The sample standard deviation was 5.2. Provide 90% and 95% confidence intervals for the population mean number of weekly customer contacts for the sales personnel. 90% Confidence interval, to 2 decimals: ( , ) 95% Confidence interval, to 2 decimals:arrow_forwardA simple random sample of 40 items resulted in a sample mean of 25. The population standard deviation is 5. a. What is the standard error of the mean (to 2 decimals)? b. At 95% confidence, what is the margin of error (to 2 decimals)?arrow_forward
- mean trough level of the population to be 3.7 micrograms/mL. The researcher conducts a study among 93 newly diagnosed arthritis patients and finds the mean trough to be 4.1 micrograms/mL with a standard deviation of 2.4 micrograms/mL. The researcher wants to test at the 5% level of significance if the trough is different than previously reported or not. Z statistics will be used. Complete Step 5 of hypothesis testing: Conclusion. State whether or not you would reject the null hypothesis and why. Also interpret what this means (i.e. is the mean trough different from 3.7 or noarrow_forward30% of all college students major in STEM (Science, Technology, Engineering, and Math). If 48 college students are randomly selected, find the probability thata. Exactly 12 of them major in STEM. b. At most 17 of them major in STEM. c. At least 12 of them major in STEM. d. Between 9 and 13 (including 9 and 13) of them major in STEM.arrow_forward7% of all Americans live in poverty. If 40 Americans are randomly selected, find the probability thata. Exactly 4 of them live in poverty. b. At most 1 of them live in poverty. c. At least 1 of them live in poverty. d. Between 2 and 9 (including 2 and 9) of them live in poverty.arrow_forward
- 48% of all violent felons in the prison system are repeat offenders. If 40 violent felons are randomly selected, find the probability that a. Exactly 18 of them are repeat offenders. b. At most 18 of them are repeat offenders. c. At least 18 of them are repeat offenders. d. Between 17 and 21 (including 17 and 21) of them are repeat offenders.arrow_forwardConsider an MA(6) model with θ1 = 0.5, θ2 = −25, θ3 = 0.125, θ4 = −0.0625, θ5 = 0.03125, and θ6 = −0.015625. Find a much simpler model that has nearly the same ψ-weights.arrow_forwardLet {Yt} be an AR(2) process of the special form Yt = φ2Yt − 2 + et. Use first principles to find the range of values of φ2 for which the process is stationary.arrow_forward
- Describe the important characteristics of the autocorrelation function for the following models: (a) MA(1), (b) MA(2), (c) AR(1), (d) AR(2), and (e) ARMA(1,1).arrow_forward« CENGAGE MINDTAP Quiz: Chapter 38 Assignment: Quiz: Chapter 38 ips Questions ra1kw08h_ch38.15m 13. 14. 15. O Which sentence has modifiers in the correct place? O a. When called, she for a medical emergency responds quickly. b. Without giving away too much of the plot, Helena described the heroine's actions in the film. O c. Nearly the snakebite victim died before the proper antitoxin was injected. . O O 16 16. O 17. 18. O 19. O 20 20. 21 21. 22. 22 DS 23. 23 24. 25. O O Oarrow_forwardQuestions ra1kw08h_ch36.14m 12. 13. 14. 15. 16. Ӧ 17. 18. 19. OS 20. Two separate sentences need Oa. two separate subjects. Ob. two dependent clauses. c. one shared subject.arrow_forward
arrow_back_ios
SEE MORE QUESTIONS
arrow_forward_ios
Recommended textbooks for you
 Glencoe Algebra 1, Student Edition, 9780079039897...AlgebraISBN:9780079039897Author:CarterPublisher:McGraw Hill
 Big Ideas Math A Bridge To Success Algebra 1: Stu...AlgebraISBN:9781680331141Author:HOUGHTON MIFFLIN HARCOURTPublisher:Houghton Mifflin Harcourt
 Holt Mcdougal Larson Pre-algebra: Student Edition...AlgebraISBN:9780547587776Author:HOLT MCDOUGALPublisher:HOLT MCDOUGAL
Glencoe Algebra 1, Student Edition, 9780079039897...
Algebra
ISBN:9780079039897
Author:Carter
Publisher:McGraw Hill
Big Ideas Math A Bridge To Success Algebra 1: Stu...
Algebra
ISBN:9781680331141
Author:HOUGHTON MIFFLIN HARCOURT
Publisher:Houghton Mifflin Harcourt
Holt Mcdougal Larson Pre-algebra: Student Edition...
Algebra
ISBN:9780547587776
Author:HOLT MCDOUGAL
Publisher:HOLT MCDOUGAL
Statistics 4.1 Point Estimators; Author: Dr. Jack L. Jackson II;https://www.youtube.com/watch?v=2MrI0J8XCEE;License: Standard YouTube License, CC-BY
Statistics 101: Point Estimators; Author: Brandon Foltz;https://www.youtube.com/watch?v=4v41z3HwLaM;License: Standard YouTube License, CC-BY
Central limit theorem; Author: 365 Data Science;https://www.youtube.com/watch?v=b5xQmk9veZ4;License: Standard YouTube License, CC-BY
Point Estimate Definition & Example; Author: Prof. Essa;https://www.youtube.com/watch?v=OTVwtvQmSn0;License: Standard Youtube License
Point Estimation; Author: Vamsidhar Ambatipudi;https://www.youtube.com/watch?v=flqhlM2bZWc;License: Standard Youtube License