
Elementary Statistics
12th Edition
ISBN: 9780321836960
Author: Mario F. Triola
Publisher: PEARSON
expand_more
expand_more
format_list_bulleted
Concept explainers
Videos
Textbook Question
Chapter 12.2, Problem 8BSC
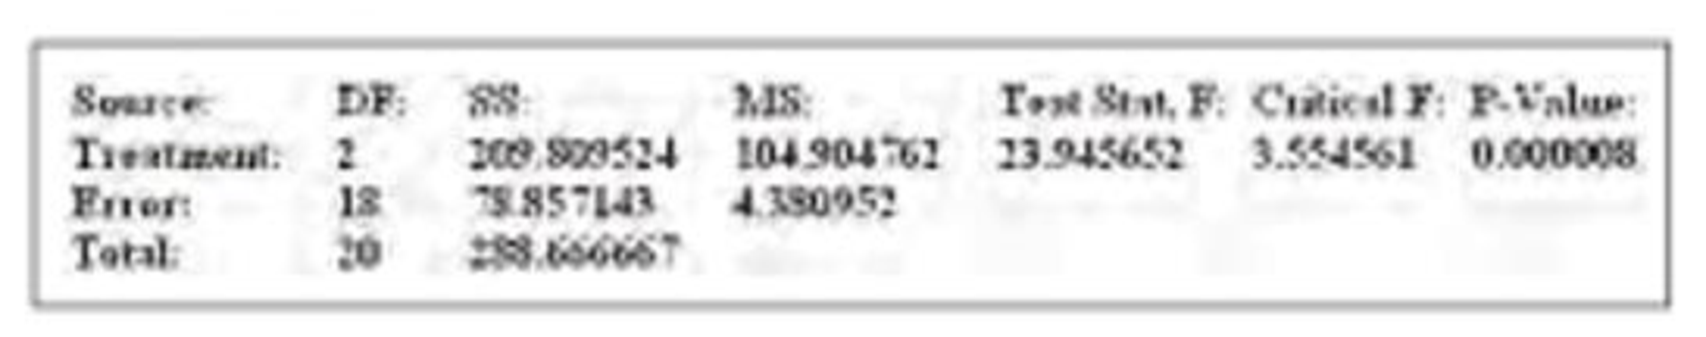
City Fuel Consumption Data Set 14 in Appendix B lists city fuel consumption amounts (mi/gal) for cars categorized by size (small, midsize, large). If we use those city fuel consumption amounts arranged into the three separate size categories, we get the STATDISK results shown here. Using a 0.05 significance level, test the claim that the three size categories have the same
STATDISK
Expert Solution & Answer
Want to see the full answer?
Check out a sample textbook solution
Students have asked these similar questions
Suppose you know that Bob's test score is
above the mean, but he doesn't remember by
how much. At least how many students must
score lower than Bob?
If a baby's weight is at the median, what's
her percentile?
At the same restaurant as in Question 19 with
the same normal distribution, what's the
chance of it taking no more than 15 minutes
to get service?
Chapter 12 Solutions
Elementary Statistics
Ch. 12.2 - In Exercises 1-4, use the following listed chest...Ch. 12.2 - Prob. 2BSCCh. 12.2 - In Exercises 1-4, use the following listed chest...Ch. 12.2 - Prob. 4BSCCh. 12.2 - In Exercises 516, use analysis of variance for the...Ch. 12.2 - In Exercises 516, use analysis of variance for the...Ch. 12.2 - Highway Fuel Consumption Data Set 14 in Appendix B...Ch. 12.2 - City Fuel Consumption Data Set 14 in Appendix B...Ch. 12.2 - Head Injury Crash Test Data Exercises 14 use chest...Ch. 12.2 - Pelvis Injury Crash Test Data Exercises 14 use...
Ch. 12.2 - Prob. 11BSCCh. 12.2 - Prob. 12BSCCh. 12.2 - Prob. 13BSCCh. 12.2 - Prob. 14BSCCh. 12.2 - Prob. 15BSCCh. 12.2 - Prob. 16BSCCh. 12.2 - Tukey Test A display of the Bonferroni test...Ch. 12.3 - Prob. 1BSCCh. 12.3 - Prob. 2BSCCh. 12.3 - Prob. 3BSCCh. 12.3 - Prob. 4BSCCh. 12.3 - Prob. 5BSCCh. 12.3 - Car Crash Tests The following table lists results...Ch. 12.3 - Prob. 7BSCCh. 12.3 - Prob. 8BSCCh. 12.3 - Self-Esteem The following table lists measures of...Ch. 12.3 - Prob. 10BSCCh. 12.3 - Prob. 11BBCh. 12 - Measures of Voltage The author measured voltage...Ch. 12 - Prob. 2CQQCh. 12 - Prob. 3CQQCh. 12 - Prob. 4CQQCh. 12 - Prob. 5CQQCh. 12 - Prob. 6CQQCh. 12 - Prob. 7CQQCh. 12 - Prob. 8CQQCh. 12 - Using the same results given in Exercise 8, does...Ch. 12 - Prob. 1RECh. 12 - Prob. 2RECh. 12 - Tar in Cigarettes Data Set 10 in Appendix B...Ch. 12 - Smoking, Body Temperature, Gender The table below...Ch. 12 - Prob. 1CRECh. 12 - Prob. 2CRECh. 12 - Prob. 3CRECh. 12 - Prob. 4CRECh. 12 - In Exercises 1-5, refer to the following list of...Ch. 12 - Freshman 15: Correlation/Regression listed below...Ch. 12 - Platelets: Normal Distribution Based on Data Set 1...Ch. 12 - Job Priority Survey USA Today reported about an...Ch. 12 - Prob. 9CRECh. 12 - Lottery: Goodness-of-Fit The bars in the histogram...Ch. 12 - Prob. 10CQQCh. 12 - Chocolate Chips Revisited The Chapter Problem for...
Knowledge Booster


Learn more about
Need a deep-dive on the concept behind this application? Look no further. Learn more about this topic, statistics and related others by exploring similar questions and additional content below.Similar questions
- Clint, obviously not in college, sleeps an average of 8 hours per night with a standard deviation of 15 minutes. What's the chance of him sleeping between 7.5 and 8.5 hours on any given night? 0-(7-0) 200 91109s and doiw $20 (8-0) mol 8520 slang $199 galbrog seam side pide & D (newid se od poyesvig as PELEO PER AFTE editiw noudab temand van Czarrow_forwardTimes to complete a statistics exam have a normal distribution with a mean of 40 minutes and standard deviation of 6 minutes. Deshawn's time comes in at the 90th percentile. What percentage of the students are still working on their exams when Deshawn leaves?arrow_forwardSuppose that the weights of cereal boxes have a normal distribution with a mean of 20 ounces and standard deviation of half an ounce. A box that has a standard score of o weighs how much? syed by ilog ni 21arrow_forward
- Bob scores 80 on both his math exam (which has a mean of 70 and standard deviation of 10) and his English exam (which has a mean of 85 and standard deviation of 5). Find and interpret Bob's Z-scores on both exams to let him know which exam (if either) he did bet- ter on. Don't, however, let his parents know; let them think he's just as good at both subjects. algas 70) sering digarrow_forwardSue's math class exam has a mean of 70 with a standard deviation of 5. Her standard score is-2. What's her original exam score?arrow_forwardClint sleeps an average of 8 hours per night with a standard deviation of 15 minutes. What's the chance he will sleep less than 7.5 hours tonight? nut bow visarrow_forward
- Suppose that your score on an exam is directly at the mean. What's your standard score?arrow_forwardOne state's annual rainfall has a normal dis- tribution with a mean of 100 inches and standard deviation of 25 inches. Suppose that corn grows best when the annual rainfall is between 100 and 150 inches. What's the chance of achieving this amount of rainfall? wved now of sociarrow_forward13 Suppose that your exam score has a standard score of 0.90. Does this mean that 90 percent of the other exam scores are lower than yours?arrow_forward
- Bob's commuting times to work have a nor- mal distribution with a mean of 45 minutes and standard deviation of 10 minutes. How often does Bob get to work in 30 to 45 minutes?arrow_forwardBob's commuting times to work have a nor- mal distribution with a mean of 45 minutes and standard deviation of 10 minutes. a. What percentage of the time does Bob get to work in 30 minutes or less? b. Bob's workday starts at 9 a.m. If he leaves at 8 a.m., how often is he late?arrow_forwardSuppose that you want to put fat Fido on a weight-loss program. Before the program, his weight had a standard score of +2 com- pared to dogs of his breed/age, and after the program, his weight has a standard score of -2. His weight before the program was 150 pounds, and the standard deviation for the breed is 5 pounds. a. What's the mean weight for Fido's breed/ age? b. What's his weight after the weight-loss program?arrow_forward
arrow_back_ios
SEE MORE QUESTIONS
arrow_forward_ios
Recommended textbooks for you
 Glencoe Algebra 1, Student Edition, 9780079039897...AlgebraISBN:9780079039897Author:CarterPublisher:McGraw Hill
 Big Ideas Math A Bridge To Success Algebra 1: Stu...AlgebraISBN:9781680331141Author:HOUGHTON MIFFLIN HARCOURTPublisher:Houghton Mifflin Harcourt
 Holt Mcdougal Larson Pre-algebra: Student Edition...AlgebraISBN:9780547587776Author:HOLT MCDOUGALPublisher:HOLT MCDOUGAL
Glencoe Algebra 1, Student Edition, 9780079039897...
Algebra
ISBN:9780079039897
Author:Carter
Publisher:McGraw Hill
Big Ideas Math A Bridge To Success Algebra 1: Stu...
Algebra
ISBN:9781680331141
Author:HOUGHTON MIFFLIN HARCOURT
Publisher:Houghton Mifflin Harcourt
Holt Mcdougal Larson Pre-algebra: Student Edition...
Algebra
ISBN:9780547587776
Author:HOLT MCDOUGAL
Publisher:HOLT MCDOUGAL
Statistics 4.1 Introduction to Inferential Statistics; Author: Dr. Jack L. Jackson II;https://www.youtube.com/watch?v=QLo4TEvBvK4;License: Standard YouTube License, CC-BY