
Elementary Statistics
12th Edition
ISBN: 9780321836960
Author: Mario F. Triola
Publisher: PEARSON
expand_more
expand_more
format_list_bulleted
Videos
Textbook Question
Chapter 12.2, Problem 17BB
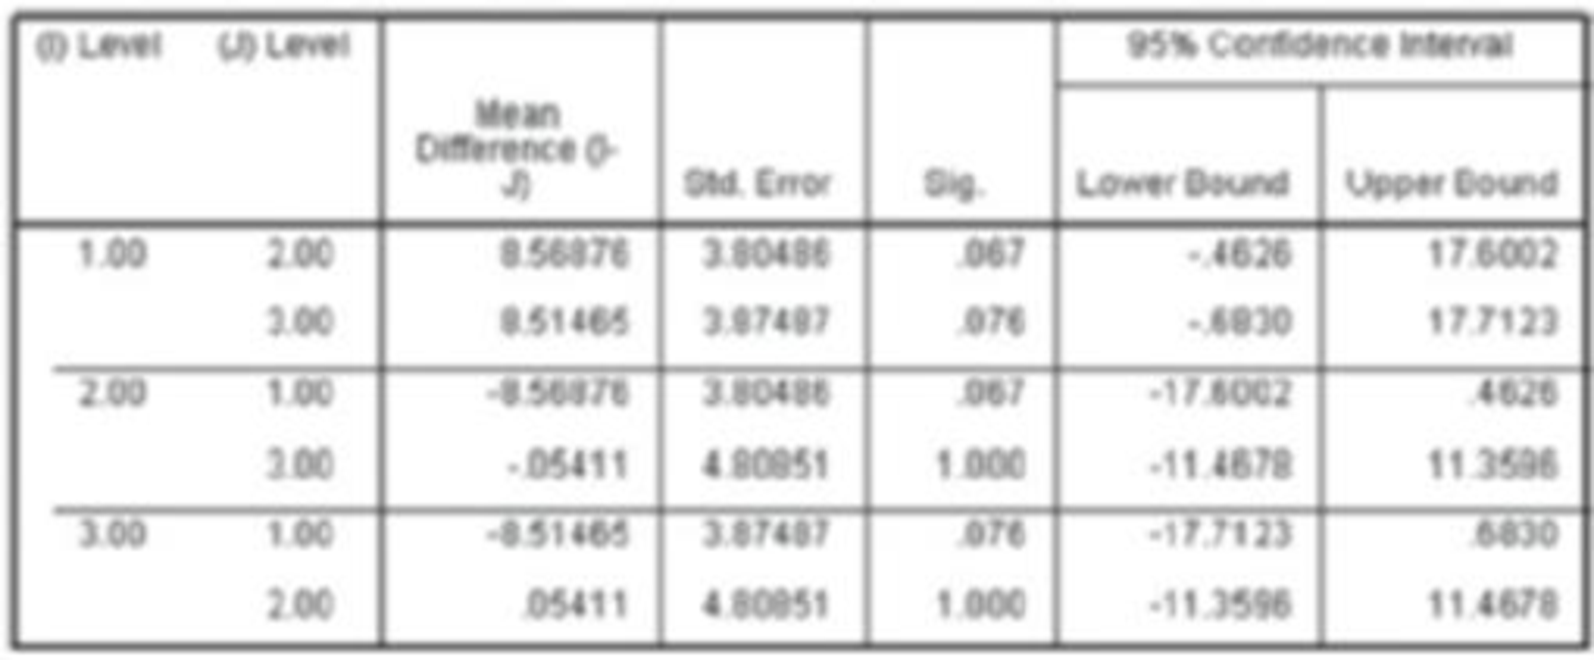
Tukey Test A display of the Bonferroni test results from Table 12-1 (which is part of the Chapter Problem) is provided on page 577. Shown on the top of the next page is the SPSS-generated display of results from the Tukey test using the same data. Compare the Tukey test results to those from the Bonferroni test.
SPSS
Expert Solution & Answer
Want to see the full answer?
Check out a sample textbook solution
Students have asked these similar questions
Show all work
Show all work
Show all work
Chapter 12 Solutions
Elementary Statistics
Ch. 12.2 - In Exercises 1-4, use the following listed chest...Ch. 12.2 - Prob. 2BSCCh. 12.2 - In Exercises 1-4, use the following listed chest...Ch. 12.2 - Prob. 4BSCCh. 12.2 - In Exercises 516, use analysis of variance for the...Ch. 12.2 - In Exercises 516, use analysis of variance for the...Ch. 12.2 - Highway Fuel Consumption Data Set 14 in Appendix B...Ch. 12.2 - City Fuel Consumption Data Set 14 in Appendix B...Ch. 12.2 - Head Injury Crash Test Data Exercises 14 use chest...Ch. 12.2 - Pelvis Injury Crash Test Data Exercises 14 use...
Ch. 12.2 - Prob. 11BSCCh. 12.2 - Prob. 12BSCCh. 12.2 - Prob. 13BSCCh. 12.2 - Prob. 14BSCCh. 12.2 - Prob. 15BSCCh. 12.2 - Prob. 16BSCCh. 12.2 - Tukey Test A display of the Bonferroni test...Ch. 12.3 - Prob. 1BSCCh. 12.3 - Prob. 2BSCCh. 12.3 - Prob. 3BSCCh. 12.3 - Prob. 4BSCCh. 12.3 - Prob. 5BSCCh. 12.3 - Car Crash Tests The following table lists results...Ch. 12.3 - Prob. 7BSCCh. 12.3 - Prob. 8BSCCh. 12.3 - Self-Esteem The following table lists measures of...Ch. 12.3 - Prob. 10BSCCh. 12.3 - Prob. 11BBCh. 12 - Measures of Voltage The author measured voltage...Ch. 12 - Prob. 2CQQCh. 12 - Prob. 3CQQCh. 12 - Prob. 4CQQCh. 12 - Prob. 5CQQCh. 12 - Prob. 6CQQCh. 12 - Prob. 7CQQCh. 12 - Prob. 8CQQCh. 12 - Using the same results given in Exercise 8, does...Ch. 12 - Prob. 1RECh. 12 - Prob. 2RECh. 12 - Tar in Cigarettes Data Set 10 in Appendix B...Ch. 12 - Smoking, Body Temperature, Gender The table below...Ch. 12 - Prob. 1CRECh. 12 - Prob. 2CRECh. 12 - Prob. 3CRECh. 12 - Prob. 4CRECh. 12 - In Exercises 1-5, refer to the following list of...Ch. 12 - Freshman 15: Correlation/Regression listed below...Ch. 12 - Platelets: Normal Distribution Based on Data Set 1...Ch. 12 - Job Priority Survey USA Today reported about an...Ch. 12 - Prob. 9CRECh. 12 - Lottery: Goodness-of-Fit The bars in the histogram...Ch. 12 - Prob. 10CQQCh. 12 - Chocolate Chips Revisited The Chapter Problem for...
Knowledge Booster


Learn more about
Need a deep-dive on the concept behind this application? Look no further. Learn more about this topic, statistics and related others by exploring similar questions and additional content below.Similar questions
- A marketing agency wants to determine whether different advertising platforms generate significantly different levels of customer engagement. The agency measures the average number of daily clicks on ads for three platforms: Social Media, Search Engines, and Email Campaigns. The agency collects data on daily clicks for each platform over a 10-day period and wants to test whether there is a statistically significant difference in the mean number of daily clicks among these platforms. Conduct ANOVA test. You can provide your answer by inserting a text box and the answer must include: also please provide a step by on getting the answers in excel Null hypothesis, Alternative hypothesis, Show answer (output table/summary table), and Conclusion based on the P value.arrow_forwardA company found that the daily sales revenue of its flagship product follows a normal distribution with a mean of $4500 and a standard deviation of $450. The company defines a "high-sales day" that is, any day with sales exceeding $4800. please provide a step by step on how to get the answers Q: What percentage of days can the company expect to have "high-sales days" or sales greater than $4800? Q: What is the sales revenue threshold for the bottom 10% of days? (please note that 10% refers to the probability/area under bell curve towards the lower tail of bell curve) Provide answers in the yellow cellsarrow_forwardBusiness Discussarrow_forward
- The following data represent total ventilation measured in liters of air per minute per square meter of body area for two independent (and randomly chosen) samples. Analyze these data using the appropriate non-parametric hypothesis testarrow_forwardeach column represents before & after measurements on the same individual. Analyze with the appropriate non-parametric hypothesis test for a paired design.arrow_forwardShould you be confident in applying your regression equation to estimate the heart rate of a python at 35°C? Why or why not?arrow_forward
arrow_back_ios
SEE MORE QUESTIONS
arrow_forward_ios
Recommended textbooks for you
 Algebra & Trigonometry with Analytic GeometryAlgebraISBN:9781133382119Author:SwokowskiPublisher:Cengage
 Linear Algebra: A Modern IntroductionAlgebraISBN:9781285463247Author:David PoolePublisher:Cengage Learning
 Holt Mcdougal Larson Pre-algebra: Student Edition...AlgebraISBN:9780547587776Author:HOLT MCDOUGALPublisher:HOLT MCDOUGAL
 Mathematics For Machine TechnologyAdvanced MathISBN:9781337798310Author:Peterson, John.Publisher:Cengage Learning,
Algebra & Trigonometry with Analytic Geometry
Algebra
ISBN:9781133382119
Author:Swokowski
Publisher:Cengage
Linear Algebra: A Modern Introduction
Algebra
ISBN:9781285463247
Author:David Poole
Publisher:Cengage Learning
Holt Mcdougal Larson Pre-algebra: Student Edition...
Algebra
ISBN:9780547587776
Author:HOLT MCDOUGAL
Publisher:HOLT MCDOUGAL
Mathematics For Machine Technology
Advanced Math
ISBN:9781337798310
Author:Peterson, John.
Publisher:Cengage Learning,
Introduction to experimental design and analysis of variance (ANOVA); Author: Dr. Bharatendra Rai;https://www.youtube.com/watch?v=vSFo1MwLoxU;License: Standard YouTube License, CC-BY