
Elementary Statistics
12th Edition
ISBN: 9780321836960
Author: Mario F. Triola
Publisher: PEARSON
expand_more
expand_more
format_list_bulleted
Videos
Textbook Question
Chapter 12, Problem 9CQQ
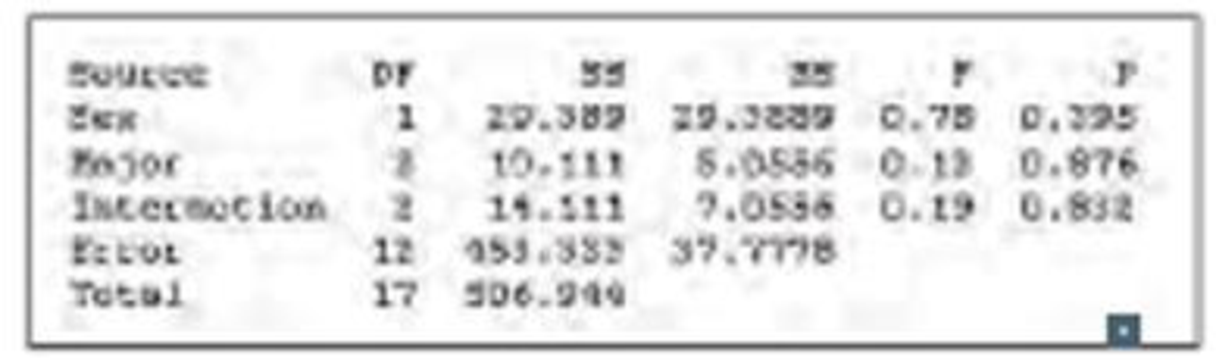
Using the same results given in Exercise 8, does it appear that the length estimates are affected by the sex of the subject?
8. Given below is a Minitab display resulting from two-way analysis of variance with sample data consisting of 18 different student estimates of the length of a classroom. The values are categorized according to sex and major (math, business, liberal arts). What do you conclude about an interaction between sex and major?
MINITAB
Expert Solution & Answer
Want to see the full answer?
Check out a sample textbook solution
Students have asked these similar questions
The following data represent total ventilation measured in liters of air per minute per square meter of body area for two independent (and randomly chosen) samples.
Analyze these data using the appropriate non-parametric hypothesis test
each column represents before & after measurements on the same individual. Analyze with the appropriate non-parametric hypothesis test for a paired design.
Should you be confident in applying your regression equation to estimate the heart rate of a python at 35°C? Why or why not?
Chapter 12 Solutions
Elementary Statistics
Ch. 12.2 - In Exercises 1-4, use the following listed chest...Ch. 12.2 - Prob. 2BSCCh. 12.2 - In Exercises 1-4, use the following listed chest...Ch. 12.2 - Prob. 4BSCCh. 12.2 - In Exercises 516, use analysis of variance for the...Ch. 12.2 - In Exercises 516, use analysis of variance for the...Ch. 12.2 - Highway Fuel Consumption Data Set 14 in Appendix B...Ch. 12.2 - City Fuel Consumption Data Set 14 in Appendix B...Ch. 12.2 - Head Injury Crash Test Data Exercises 14 use chest...Ch. 12.2 - Pelvis Injury Crash Test Data Exercises 14 use...
Ch. 12.2 - Prob. 11BSCCh. 12.2 - Prob. 12BSCCh. 12.2 - Prob. 13BSCCh. 12.2 - Prob. 14BSCCh. 12.2 - Prob. 15BSCCh. 12.2 - Prob. 16BSCCh. 12.2 - Tukey Test A display of the Bonferroni test...Ch. 12.3 - Prob. 1BSCCh. 12.3 - Prob. 2BSCCh. 12.3 - Prob. 3BSCCh. 12.3 - Prob. 4BSCCh. 12.3 - Prob. 5BSCCh. 12.3 - Car Crash Tests The following table lists results...Ch. 12.3 - Prob. 7BSCCh. 12.3 - Prob. 8BSCCh. 12.3 - Self-Esteem The following table lists measures of...Ch. 12.3 - Prob. 10BSCCh. 12.3 - Prob. 11BBCh. 12 - Measures of Voltage The author measured voltage...Ch. 12 - Prob. 2CQQCh. 12 - Prob. 3CQQCh. 12 - Prob. 4CQQCh. 12 - Prob. 5CQQCh. 12 - Prob. 6CQQCh. 12 - Prob. 7CQQCh. 12 - Prob. 8CQQCh. 12 - Using the same results given in Exercise 8, does...Ch. 12 - Prob. 1RECh. 12 - Prob. 2RECh. 12 - Tar in Cigarettes Data Set 10 in Appendix B...Ch. 12 - Smoking, Body Temperature, Gender The table below...Ch. 12 - Prob. 1CRECh. 12 - Prob. 2CRECh. 12 - Prob. 3CRECh. 12 - Prob. 4CRECh. 12 - In Exercises 1-5, refer to the following list of...Ch. 12 - Freshman 15: Correlation/Regression listed below...Ch. 12 - Platelets: Normal Distribution Based on Data Set 1...Ch. 12 - Job Priority Survey USA Today reported about an...Ch. 12 - Prob. 9CRECh. 12 - Lottery: Goodness-of-Fit The bars in the histogram...Ch. 12 - Prob. 10CQQCh. 12 - Chocolate Chips Revisited The Chapter Problem for...
Knowledge Booster


Learn more about
Need a deep-dive on the concept behind this application? Look no further. Learn more about this topic, statistics and related others by exploring similar questions and additional content below.Similar questions
- Given your fitted regression line, what would be the residual for snake #5 (10 C)?arrow_forwardCalculate the 95% confidence interval around your estimate of r using Fisher’s z-transformation. In your final answer, make sure to back-transform to the original units.arrow_forwardCalculate Pearson’s correlation coefficient (r) between temperature and heart rate.arrow_forward
- A researcher wishes to estimate, with 90% confidence, the population proportion of adults who support labeling legislation for genetically modified organisms (GMOs). Her estimate must be accurate within 4% of the true proportion. (a) No preliminary estimate is available. Find the minimum sample size needed. (b) Find the minimum sample size needed, using a prior study that found that 65% of the respondents said they support labeling legislation for GMOs. (c) Compare the results from parts (a) and (b). ... (a) What is the minimum sample size needed assuming that no prior information is available? n = (Round up to the nearest whole number as needed.)arrow_forwardThe table available below shows the costs per mile (in cents) for a sample of automobiles. At a = 0.05, can you conclude that at least one mean cost per mile is different from the others? Click on the icon to view the data table. Let Hss, HMS, HLS, Hsuv and Hмy represent the mean costs per mile for small sedans, medium sedans, large sedans, SUV 4WDs, and minivans respectively. What are the hypotheses for this test? OA. Ho: Not all the means are equal. Ha Hss HMS HLS HSUV HMV B. Ho Hss HMS HLS HSUV = μMV Ha: Hss *HMS *HLS*HSUV * HMV C. Ho Hss HMS HLS HSUV =μMV = = H: Not all the means are equal. D. Ho Hss HMS HLS HSUV HMV Ha Hss HMS HLS =HSUV = HMVarrow_forwardQuestion: A company launches two different marketing campaigns to promote the same product in two different regions. After one month, the company collects the sales data (in units sold) from both regions to compare the effectiveness of the campaigns. The company wants to determine whether there is a significant difference in the mean sales between the two regions. Perform a two sample T-test You can provide your answer by inserting a text box and the answer must include: Null hypothesis, Alternative hypothesis, Show answer (output table/summary table), and Conclusion based on the P value. (2 points = 0.5 x 4 Answers) Each of these is worth 0.5 points. However, showing the calculation is must. If calculation is missing, the whole answer won't get any credit.arrow_forward
arrow_back_ios
SEE MORE QUESTIONS
arrow_forward_ios
Recommended textbooks for you
 Glencoe Algebra 1, Student Edition, 9780079039897...AlgebraISBN:9780079039897Author:CarterPublisher:McGraw Hill
 Holt Mcdougal Larson Pre-algebra: Student Edition...AlgebraISBN:9780547587776Author:HOLT MCDOUGALPublisher:HOLT MCDOUGAL
 Big Ideas Math A Bridge To Success Algebra 1: Stu...AlgebraISBN:9781680331141Author:HOUGHTON MIFFLIN HARCOURTPublisher:Houghton Mifflin Harcourt
Glencoe Algebra 1, Student Edition, 9780079039897...
Algebra
ISBN:9780079039897
Author:Carter
Publisher:McGraw Hill
Holt Mcdougal Larson Pre-algebra: Student Edition...
Algebra
ISBN:9780547587776
Author:HOLT MCDOUGAL
Publisher:HOLT MCDOUGAL
Big Ideas Math A Bridge To Success Algebra 1: Stu...
Algebra
ISBN:9781680331141
Author:HOUGHTON MIFFLIN HARCOURT
Publisher:Houghton Mifflin Harcourt
Hypothesis Testing using Confidence Interval Approach; Author: BUM2413 Applied Statistics UMP;https://www.youtube.com/watch?v=Hq1l3e9pLyY;License: Standard YouTube License, CC-BY
Hypothesis Testing - Difference of Two Means - Student's -Distribution & Normal Distribution; Author: The Organic Chemistry Tutor;https://www.youtube.com/watch?v=UcZwyzwWU7o;License: Standard Youtube License