
Elementary Statistics (13th Edition)
13th Edition
ISBN: 9780134462455
Author: Mario F. Triola
Publisher: PEARSON
expand_more
expand_more
format_list_bulleted
Videos
Textbook Question
Chapter 12.1, Problem 1BSC
In Exercises 1-4, use the following listed arrival delay times (minutes) for American Airline flights from New York to Los Angeles. Negative values correspond to flights that arrived early. Also shown are the SPSS results for analysis of variance. Assume that we plan to use a 0.05 significance level to test the claim that the different flights have the same
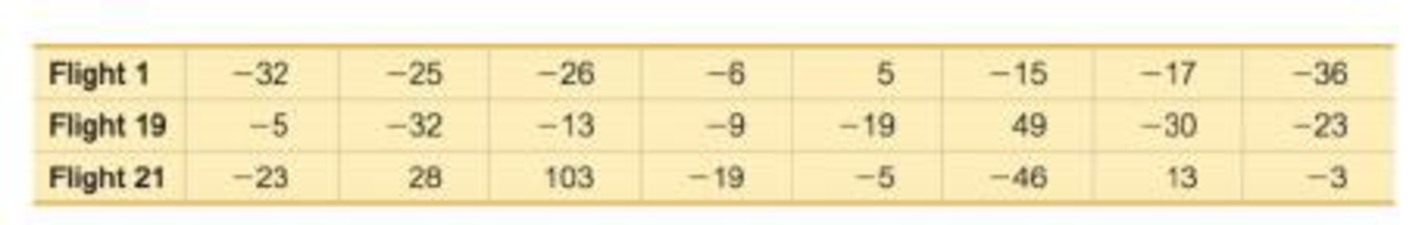
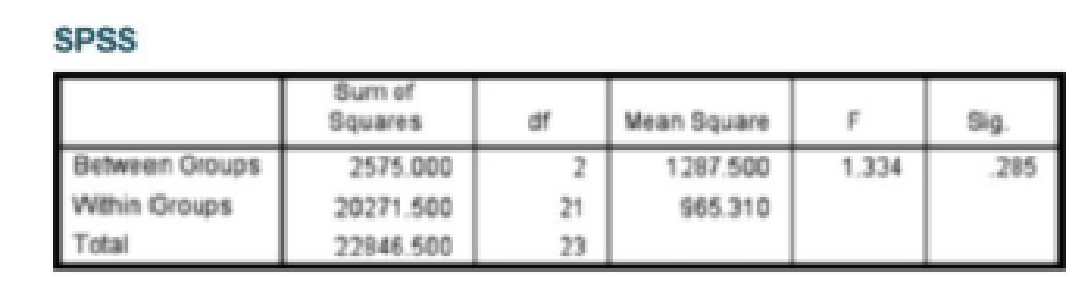
1. ANOVA
a. What characteristic of the data above indicates that we should use one-way analysis of variance?
b. If the objective is to test the claim that the three flights have the same mean arrival delay time, why is the method referred to as analysis of variance?
Expert Solution & Answer
Want to see the full answer?
Check out a sample textbook solution
Students have asked these similar questions
Business Discuss
The following data represent total ventilation measured in liters of air per minute per square meter of body area for two independent (and randomly chosen) samples.
Analyze these data using the appropriate non-parametric hypothesis test
each column represents before & after measurements on the same individual. Analyze with the appropriate non-parametric hypothesis test for a paired design.
Chapter 12 Solutions
Elementary Statistics (13th Edition)
Ch. 12.1 - In Exercises 1-4, use the following listed arrival...Ch. 12.1 - In Exercises 1-4, use the following listed arrival...Ch. 12.1 - In Exercises 1-4, use the following listed arrival...Ch. 12.1 - In Exercises 1-4, use the following listed arrival...Ch. 12.1 - In Exercises 5-16, use analysis of variance for...Ch. 12.1 - In Exercises 5-16, use analysis of variance for...Ch. 12.1 - In Exercises 5-16, use analysis of variance for...Ch. 12.1 - In Exercises 5-16, use analysis of variance for...Ch. 12.1 - In Exercises 5-16, use analysis of variance for...Ch. 12.1 - Prob. 10BSC
Ch. 12.1 - Triathlon Times Jeff Parent is a statistics...Ch. 12.1 - Arsenic in Rice Listed below are amounts of...Ch. 12.1 - Prob. 13BSCCh. 12.1 - Speed Dating Listed below are attribute ratings of...Ch. 12.1 - In Exercises 15 and 16, use the data set in...Ch. 12.1 - In Exercises 15 and 16, use the data set in...Ch. 12.1 - Tukey Test A display of the Bonferroni test...Ch. 12.2 - Two-Way ANOVA The pulse rates in Table 12-3 from...Ch. 12.2 - Two-Way ANOVA If we have a goal of using the data...Ch. 12.2 - Interaction a. What is an interaction between two...Ch. 12.2 - Balanced Design Does the table given in Exercise 1...Ch. 12.2 - Pulse Rates If we use the data given in Exercise 1...Ch. 12.2 - Weights The weights (kg) in the following table...Ch. 12.2 - Heights The heights (cm) in the following table...Ch. 12.2 - Pancake Experiment Listed below are ratings of...Ch. 12.2 - Marathon Times Listed below are New York City...Ch. 12.2 - Smoking, Gender, and Body Temperature The table...Ch. 12.2 - Transformations of Data Example 1 illustrated the...Ch. 12 - Cola Weights Data Set 26 Cola Weights and Volumes...Ch. 12 - Cola Weights For the four samples described in...Ch. 12 - Cola Weights For the analysis of variance test...Ch. 12 - Cola Weights Identify the value of the test...Ch. 12 - Cola Weights The displayed results from Exercise 1...Ch. 12 - One-Way ANOVA In general, what is one-way analysis...Ch. 12 - One vs. Two What is the fundamental difference...Ch. 12 - Estimating Length Given below is a Minitab display...Ch. 12 - Estimating Length Using the same results displayed...Ch. 12 - Estimating Length Using the same results displayed...Ch. 12 - Speed Dating Data Set 18 Speed Dating in Appendix...Ch. 12 - Author Readability Pages were randomly selected by...Ch. 12 - Prob. 3RECh. 12 - Speed Dating Listed below are attribute ratings of...Ch. 12 - In Exercises 1-5, refer to the following list of...Ch. 12 - In Exercises 1-5, refer to the following list of...Ch. 12 - In Exercises 1-5, refer to the following list of...Ch. 12 - In Exercises 15, refer to the following list of...Ch. 12 - In Exercises 15, refer to the following list of...Ch. 12 - Quarters Assume that weights of quarters minted...Ch. 12 - Job Priority Survey USA Today reported on an...Ch. 12 - Win 4 Lottery Shown below is a histogram of digits...Ch. 12 - Does Weight Change with Age? Refer to Data Set 1...
Knowledge Booster


Learn more about
Need a deep-dive on the concept behind this application? Look no further. Learn more about this topic, statistics and related others by exploring similar questions and additional content below.Similar questions
- Should you be confident in applying your regression equation to estimate the heart rate of a python at 35°C? Why or why not?arrow_forwardGiven your fitted regression line, what would be the residual for snake #5 (10 C)?arrow_forwardCalculate the 95% confidence interval around your estimate of r using Fisher’s z-transformation. In your final answer, make sure to back-transform to the original units.arrow_forward
- BUSINESS DISCUSSarrow_forwardA researcher wishes to estimate, with 90% confidence, the population proportion of adults who support labeling legislation for genetically modified organisms (GMOs). Her estimate must be accurate within 4% of the true proportion. (a) No preliminary estimate is available. Find the minimum sample size needed. (b) Find the minimum sample size needed, using a prior study that found that 65% of the respondents said they support labeling legislation for GMOs. (c) Compare the results from parts (a) and (b). ... (a) What is the minimum sample size needed assuming that no prior information is available? n = (Round up to the nearest whole number as needed.)arrow_forwardThe table available below shows the costs per mile (in cents) for a sample of automobiles. At a = 0.05, can you conclude that at least one mean cost per mile is different from the others? Click on the icon to view the data table. Let Hss, HMS, HLS, Hsuv and Hмy represent the mean costs per mile for small sedans, medium sedans, large sedans, SUV 4WDs, and minivans respectively. What are the hypotheses for this test? OA. Ho: Not all the means are equal. Ha Hss HMS HLS HSUV HMV B. Ho Hss HMS HLS HSUV = μMV Ha: Hss *HMS *HLS*HSUV * HMV C. Ho Hss HMS HLS HSUV =μMV = = H: Not all the means are equal. D. Ho Hss HMS HLS HSUV HMV Ha Hss HMS HLS =HSUV = HMVarrow_forward
arrow_back_ios
SEE MORE QUESTIONS
arrow_forward_ios
Recommended textbooks for you
 Glencoe Algebra 1, Student Edition, 9780079039897...AlgebraISBN:9780079039897Author:CarterPublisher:McGraw Hill
 Holt Mcdougal Larson Pre-algebra: Student Edition...AlgebraISBN:9780547587776Author:HOLT MCDOUGALPublisher:HOLT MCDOUGAL
 Big Ideas Math A Bridge To Success Algebra 1: Stu...AlgebraISBN:9781680331141Author:HOUGHTON MIFFLIN HARCOURTPublisher:Houghton Mifflin Harcourt
Glencoe Algebra 1, Student Edition, 9780079039897...
Algebra
ISBN:9780079039897
Author:Carter
Publisher:McGraw Hill
Holt Mcdougal Larson Pre-algebra: Student Edition...
Algebra
ISBN:9780547587776
Author:HOLT MCDOUGAL
Publisher:HOLT MCDOUGAL
Big Ideas Math A Bridge To Success Algebra 1: Stu...
Algebra
ISBN:9781680331141
Author:HOUGHTON MIFFLIN HARCOURT
Publisher:Houghton Mifflin Harcourt
Introduction to experimental design and analysis of variance (ANOVA); Author: Dr. Bharatendra Rai;https://www.youtube.com/watch?v=vSFo1MwLoxU;License: Standard YouTube License, CC-BY