
PRINCIPLES OF ECONOMICS
14th Edition
ISBN: 2810015433483
Author: OpenStax
Publisher: OpenStax
expand_more
expand_more
format_list_bulleted
Textbook Question
Chapter 12, Problem 9SCQ
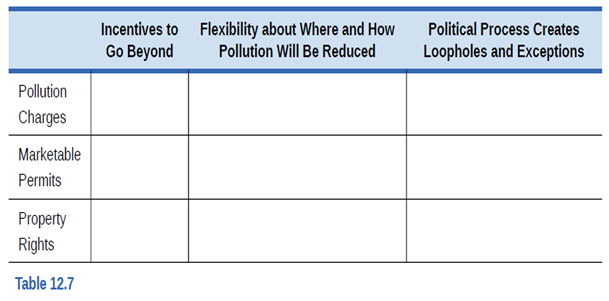
The rows in Table 12.7 show three market-oriented tools for reducing pollution. The columns of the table show three complaints about command-and-control regulation. Fill in the table by stating briefly how each market-oriented tool addresses each of the three concerns.
Expert Solution & Answer
Want to see the full answer?
Check out a sample textbook solution
Students have asked these similar questions
Simple explanations pls
This question examines the relationship between the Indian rupee (Rs) and the US dollar ($). We
denote the exchange rate in rupees per dollar as ERS/$. Suppose the Bank of India permanently
decreases its money supply by 4%.
1. First, consider the effect in the long run. Using the following equation, explain how the change
in India's money supply affects the Indian price level, PIN, and the exchange rate, ERS/$:
AERS/STIN
ERS/$
-
·TUS = (MIN - 9IN) - (Mus - gus).
MIN
2. How does the decrease in India's money supply affect the real money supply,
in the long
PIN
run.
3. Based on your previous answer, how does the decrease in the Indian money supply affect the
nominal interest rate, UN, in the long run? (hint: M = L(i)Y hold in the long run)
4. Illustrate the graphs to show how a permanent decrease in India's money supply affects India's
money and FX markets in the long run. (hint: you may refer to the figures on lecture slides #5,
titled "Analysis in the long run.")
5. Illustrate the…
Please explain the concept/what this fill in graph, thanks
Chapter 12 Solutions
PRINCIPLES OF ECONOMICS
Ch. 12 - Identify the following situations as an example of...Ch. 12 - Identify whether the market supply curve will...Ch. 12 - For each of your answers to Exercise 12.2, will...Ch. 12 - Table 12.5 provides the supply and demand...Ch. 12 - Consider two approaches to reducing emissions of...Ch. 12 - Classify the following pollution-control policies...Ch. 12 - An emissions tax on a quantity of emissions from a...Ch. 12 - Four films called Elm, Maple, Oak, and (Shelly,...Ch. 12 - The rows in Table 12.7 show three market-oriented...Ch. 12 - Suppose a city releases 16 million gallons of raw...
Ch. 12 - The state of Colorado requires oil and gas...Ch. 12 - Consider the case of global environmental problems...Ch. 12 - A country called Sherwood is very heavily covered...Ch. 12 - What is an externality?Ch. 12 - Give an example of a positive externality and an...Ch. 12 - What is the difference between private costs and...Ch. 12 - In a market without environmental regulations,...Ch. 12 - What is command-and-control environmental...Ch. 12 - What are the three problems that economists have...Ch. 12 - What is a pollution charge and what incentive does...Ch. 12 - What is a marketable permit and what incentive...Ch. 12 - What are better-defined property rights and what...Ch. 12 - As the extent of environmental protection expands,...Ch. 12 - As the extent of environmental protection expands,...Ch. 12 - What are the economic tradeoffs between low-income...Ch. 12 - What arguments d0 low-income countries make in...Ch. 12 - In the tradeoff between economic output and...Ch. 12 - What does a point inside the production...Ch. 12 - Suppose you want to put a dollar value on the...Ch. 12 - Would environmentalists favor command-and-control...Ch. 12 - Consider two ways of protecting elephants from...Ch. 12 - Will a system of marketable permits work with...Ch. 12 - Is zero pollution possible under a marketable...Ch. 12 - Is zero pollution an optimal goal? Way or why not?Ch. 12 - From an economic perspective, is it sound policy...Ch. 12 - Recycling is a relatively inexpensive solution to...Ch. 12 - Can extreme levels of pollution hurt the economic...Ch. 12 - How can high-income countries benefit from...Ch. 12 - Technological innovations shift the production...Ch. 12 - Show the market for cigarettes in equilibrium,...Ch. 12 - Refer to Table 12.2. The externality created by...Ch. 12 - Table 12.12, shows the supply and demand...Ch. 12 - A city currently emits 15 million gallons (MG) of...Ch. 12 - In the Land of Purity, there is only one form of...
Additional Business Textbook Solutions
Find more solutions based on key concepts
(NPV calculation) Calculate the NPV given the following free cash flows if the appropriate required rate of ret...
Foundations Of Finance
The meaning of stock’s alpha and its interpretation. Introduction: Stock is a type of security in a company tha...
Corporate Finance (4th Edition) (Pearson Series in Finance) - Standalone book
1-13. Identify a product, either a good or a service, that will take advantage of this opportunity. Although yo...
Business Essentials (12th Edition) (What's New in Intro to Business)
4. JC Manufacturing purchase d inventory for $ 5,300 and al so paid a $260 freight bill. JC Manufacturing retur...
Horngren's Financial & Managerial Accounting, The Financial Chapters (Book & Access Card)
Determine the FW of the following engineering project when the MARR is 15% per year. Is the project acceptable?...
Engineering Economy (17th Edition)
Discussion Questions 1. What characteristics of the product or manufacturing process would lead a company to us...
Managerial Accounting (5th Edition)
Knowledge Booster

Similar questions
- Elasticity Problems Cross Price Elasticity (Exy) (QDX-QDo/[(QDN+QDDA)/2] (P-POR/[(PNE+POB)/2]¯¯ 11. QD of good A falls from 100 to 90 as the price of good B rose from $10 to $20. Calculate coefficient: (90-100) [(90+100) 21-10/95-105 - -.158 (20-10)/[(20+10)/2] 10/15 .667 Cite Elasticity: inclastic Typs of good: complement 12. QD of good A rose from 300 to 400 as the price good K increased from $1 to $2. Calculate coefficient Cite Elasticity: Ixps of reed: 13. QD for good I falls from 2000 to 1500 units as price of good Krose from $10 to $15. Calculate coefficient: Cite Elasticity: Type of good: 14. QD for good X rose from 100 to 101 units as price of good Y increases from, $8 to $15. Calculate coefficient: Cite Elasticity: Type of paed: Page 124 (368) Value of Coefficient Description Positive (0) Negative (L*0) Type of Good(s) Substitute Quantity Demanded of W changes in same direction a change in price if Z Quantity Demanded of W changes in opposite direction as change in price if Z…arrow_forwardUse production theory to graphically illustrate the case in which a medical innovation improves health without any change in the consumption of medical care.arrow_forwardAccording to Lee et al. (2009), the incremental cost-effectiveness ratio comparing the current dialysis treatment to the next least cost dialysis treatment is $61,294 per life year and $129,090 per QALY. Can you account for the different estimates?arrow_forward
- You are employed as an economic consultant to the regional planning office of a large metropolitan area, and your task is to estimate the demand for hospital services in the area. Your estimates indicate that the own-price elasticity of demand equals 0.25, the income elasticity of demand equals 0.45, the cross-price elasticity of demand for hospital services with respect to the price of nursing home services equals 0.1, and the elasticity of travel time equals −0.37. Use this information to project the impact of the following changes on the demand for hospital services. Average travel time to the hospital diminishes by 5 percent due to overall improvements in the public transportation system. The price of nursing home care decreases by 10 percent. Average real income decreases by 10 percent. The hospital is forced to increase its price for services by 2 percent.arrow_forwardThe commissioner of health is concerned about the increasing number of reported cases of preventable childhood diseases, such as polio and rubella. It appears that a growing number of young children are not being vaccinated against childhood diseases as they should be. Two proposals to address the problem are sitting on the commissioner’s desk. The programs have equal costs, but the commissioner has funding for only one. The first proposal involves providing free vaccinations at clinics around the country. The benefits from a free vaccination program are likely to be experienced immediately in terms of a drop in the number of reported cases of illness. The second program calls for educating young married couples about the benefits of vaccination. The benefits in this instance will not be felt for some years. The commissioner wants to use cost-benefit analysis to determine which proposal should be implemented. Explain to the commissioner the critical role the discount rate plays in…arrow_forwardWhich of the following Nobel Prize Winners’ primary work in investments was consistent with market efficiency? Mark each “Yes” or “No.” You can search the internet for more information about their Nobel Prizes. Eugene Fama Harry Markowitz William Sharpe Robert Shillerarrow_forward
- not use ai pleasearrow_forwardNot use ai pleasearrow_forwardExercise 6 Imagine that you head production of a multinational food processing company. The ongoing uncer- tainty about costs means that you are unsure of the future cost of one of your inputs, x2. Your firm's production function is y = f(x1, x2) = x²x²² The output price p is 1000, x1 = 27, and wx₁ = 60. 1. Suppose the current input price is Wx2 = 50. Solve for the optimal choice of x2. 2. Now suppose that the probability the input price remains 50 is 0.65 and the probability that Wx2 60 is 0.35. Solve for the optimal choice of x2. Round down to the nearest integer. = 3. Finally, suppose the costs do actually rise, i.e., Wx2 = 60. Calculate the difference in profit from the uncertainty in (2) vs. the certainty in (1).arrow_forward
- Not use ai please letarrow_forwardQuestions from textbook: Santerre, Rexford, E., and Neun, Stephan P. Health Economics: Theories, Insights, and Industry Studies, 6th Edition, ISBN 13: 978-1-111-822729. Mason, OH: South-Western, Cengage Learning, 2013. 1. Suppose a health expenditure function is specified in the following manner: E = 500 + 0.2Y where E represents annual health care expenditures per capita and Y stands for income per capita. a. Using the slope of the health expenditure function, predict the change in per capita health care expenditures that would result from a $1,000 increase in per capita income. b. Compute the level of per capita health care spending when per capita income takes on the following dollar values: 0; 1,000; 2,000; 4,000; and 6,000. c. Using the resulting values for per capita health care spending in part B, graph the associated health care expenditure function. d. Assume that the fixed amount of health care spending decreases to $250. Graph the new and original health care functions on…arrow_forwardGraph shows the daily market price of jeans when the tax on sellers is set to zero per pair supposed the government institutes attacks of $20.30 per pair to be paid by the seller what is the quantity after taxarrow_forward
arrow_back_ios
SEE MORE QUESTIONS
arrow_forward_ios
Recommended textbooks for you


 Economics (MindTap Course List)EconomicsISBN:9781337617383Author:Roger A. ArnoldPublisher:Cengage Learning
 Managerial Economics: Applications, Strategies an...EconomicsISBN:9781305506381Author:James R. McGuigan, R. Charles Moyer, Frederick H.deB. HarrisPublisher:Cengage Learning
Economics (MindTap Course List)
Economics
ISBN:9781337617383
Author:Roger A. Arnold
Publisher:Cengage Learning
Managerial Economics: Applications, Strategies an...
Economics
ISBN:9781305506381
Author:James R. McGuigan, R. Charles Moyer, Frederick H.deB. Harris
Publisher:Cengage Learning