
A city currently emits 15 million gallons (MG) of raw sewage into a lake that is beside the city. Table 12.13 shows the total costs (TC) in thousands of dollars of cleaning up the sewage to different levels, together with the total benefits (TB) of doing so. Benefits include environmental, recreational, health, and industrial benefits.
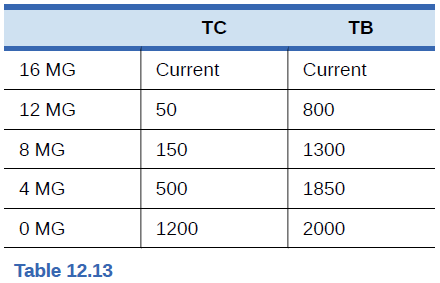
- Using the information in Table 12.13 calculate the marginal costs and marginal benefits of reducing sewage emissions for this City.
- What is the optimal level of sewage for this city? How can you tell?

Trending nowThis is a popular solution!

Chapter 12 Solutions
PRINCIPLES OF ECONOMICS
Additional Business Textbook Solutions
Business Essentials (12th Edition) (What's New in Intro to Business)
Gitman: Principl Manageri Finance_15 (15th Edition) (What's New in Finance)
Engineering Economy (17th Edition)
Financial Accounting, Student Value Edition (5th Edition)
Horngren's Financial & Managerial Accounting, The Financial Chapters (Book & Access Card)
Operations Management: Processes and Supply Chains (12th Edition) (What's New in Operations Management)

- Questions from textbook: Santerre, Rexford, E., and Neun, Stephan P. Health Economics: Theories, Insights, and Industry Studies, 6th Edition, ISBN 13: 978-1-111-822729. Mason, OH: South-Western, Cengage Learning, 2013. 1. Suppose a health expenditure function is specified in the following manner: E = 500 + 0.2Y where E represents annual health care expenditures per capita and Y stands for income per capita. a. Using the slope of the health expenditure function, predict the change in per capita health care expenditures that would result from a $1,000 increase in per capita income. b. Compute the level of per capita health care spending when per capita income takes on the following dollar values: 0; 1,000; 2,000; 4,000; and 6,000. c. Using the resulting values for per capita health care spending in part B, graph the associated health care expenditure function. d. Assume that the fixed amount of health care spending decreases to $250. Graph the new and original health care functions on…arrow_forwardGraph shows the daily market price of jeans when the tax on sellers is set to zero per pair supposed the government institutes attacks of $20.30 per pair to be paid by the seller what is the quantity after taxarrow_forwardHow do you figure out tax incidents in elasticityarrow_forward


 Economics (MindTap Course List)EconomicsISBN:9781337617383Author:Roger A. ArnoldPublisher:Cengage Learning

 Microeconomics: Principles & PolicyEconomicsISBN:9781337794992Author:William J. Baumol, Alan S. Blinder, John L. SolowPublisher:Cengage Learning