
Videos
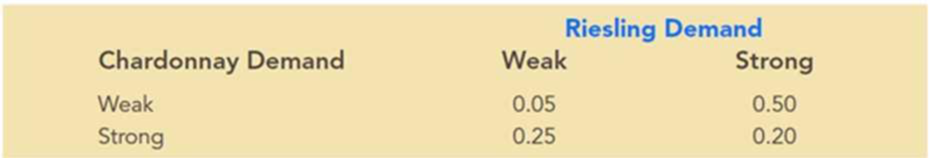
Seneca Hill Winery recently purchased land for the purpose of establishing a new vineyard. Management is considering two varieties of white grapes for the new vineyard: Chardonnay and Riesling. The Chardonnay grapes would be used to produce a dry Chardonnay wine, and the Riesling grapes would be used to produce a semidry Riesling wine. It takes approximately four years from the time of planting before new grapes can be harvested. This length of time creates a great deal of uncertainty concerning future demand and makes the decision about the type of grapes to plant difficult. Three possibilities are being considered: Chardonnay grapes only; Riesling grapes only; and both Chardonnay and Riesling grapes. Seneca management decided that for planning purposes it would be adequate to consider only two demand possibilities for each type of wine: strong or weak. With two possibilities for each type of wine, it was necessary to assess four probabilities. With the help of some forecasts in industry publications, management made the following
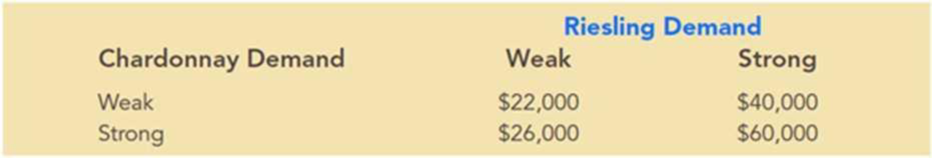
Revenue projections show an annual contribution to profit of $20,000 if Seneca Hill plants only Chardonnay grapes and demand is weak for Chardonnay wine, and $70,000 if Seneca plants only Chardonnay grapes and demand is strong for Chardonnay wine. If Seneca plants only Riesling grapes, the annual profit projection is $25,000 if demand is weak for Riesling grapes and $45,000 if demand is strong for Riesling grapes. If Seneca plants both types of grapes, the annual profit projections are shown in the following table:
- a. What is the decision to be made, what is the chance
event , and what is the consequence? Identify the alternatives for the decisions and the possible outcomes for the chance events. - b. Develop a decision tree.
- c. Use the
expected value approach to recommend which alternative Seneca Hill Winery should follow in order to maximize expected annual profit. - d. Suppose management is concerned about the probability assessments when demand for Chardonnay wine is strong. Some believe it is likely for Riesling demand to also be strong in this case. Suppose that the probability of strong demand for Chardonnay and weak demand for Riesling is 0.05 and that the probability of strong demand for Chardonnay and strong demand for Riesling is 0.40. How does this change the recommended decision? Assume that the probabilities when Chardonnay demand is weak are still 0.05 and 0.50.
- e. Other members of the management team expect the Chardonnay market to become saturated at some point in the future, causing a fall in prices. Suppose that the annual profit projections fall to $50,000 when demand for Chardonnay is strong and only Chardonnay grapes are planted. Using the original probability assessments, determine how this change would affect the optimal decision.
Want to see the full answer?
Check out a sample textbook solution
Chapter 12 Solutions
Essentials Of Business Analytics


- Harvard University California Institute of Technology Massachusetts Institute of Technology Stanford University Princeton University University of Cambridge University of Oxford University of California, Berkeley Imperial College London Yale University University of California, Los Angeles University of Chicago Johns Hopkins University Cornell University ETH Zurich University of Michigan University of Toronto Columbia University University of Pennsylvania Carnegie Mellon University University of Hong Kong University College London University of Washington Duke University Northwestern University University of Tokyo Georgia Institute of Technology Pohang University of Science and Technology University of California, Santa Barbara University of British Columbia University of North Carolina at Chapel Hill University of California, San Diego University of Illinois at Urbana-Champaign National University of Singapore McGill…arrow_forwardName Harvard University California Institute of Technology Massachusetts Institute of Technology Stanford University Princeton University University of Cambridge University of Oxford University of California, Berkeley Imperial College London Yale University University of California, Los Angeles University of Chicago Johns Hopkins University Cornell University ETH Zurich University of Michigan University of Toronto Columbia University University of Pennsylvania Carnegie Mellon University University of Hong Kong University College London University of Washington Duke University Northwestern University University of Tokyo Georgia Institute of Technology Pohang University of Science and Technology University of California, Santa Barbara University of British Columbia University of North Carolina at Chapel Hill University of California, San Diego University of Illinois at Urbana-Champaign National University of Singapore…arrow_forwardA company found that the daily sales revenue of its flagship product follows a normal distribution with a mean of $4500 and a standard deviation of $450. The company defines a "high-sales day" that is, any day with sales exceeding $4800. please provide a step by step on how to get the answers in excel Q: What percentage of days can the company expect to have "high-sales days" or sales greater than $4800? Q: What is the sales revenue threshold for the bottom 10% of days? (please note that 10% refers to the probability/area under bell curve towards the lower tail of bell curve) Provide answers in the yellow cellsarrow_forward
- Find the critical value for a left-tailed test using the F distribution with a 0.025, degrees of freedom in the numerator=12, and degrees of freedom in the denominator = 50. A portion of the table of critical values of the F-distribution is provided. Click the icon to view the partial table of critical values of the F-distribution. What is the critical value? (Round to two decimal places as needed.)arrow_forwardA retail store manager claims that the average daily sales of the store are $1,500. You aim to test whether the actual average daily sales differ significantly from this claimed value. You can provide your answer by inserting a text box and the answer must include: Null hypothesis, Alternative hypothesis, Show answer (output table/summary table), and Conclusion based on the P value. Showing the calculation is a must. If calculation is missing,so please provide a step by step on the answers Numerical answers in the yellow cellsarrow_forwardShow all workarrow_forward
 Algebra & Trigonometry with Analytic GeometryAlgebraISBN:9781133382119Author:SwokowskiPublisher:Cengage
 College Algebra (MindTap Course List)AlgebraISBN:9781305652231Author:R. David Gustafson, Jeff HughesPublisher:Cengage Learning
 Linear Algebra: A Modern IntroductionAlgebraISBN:9781285463247Author:David PoolePublisher:Cengage Learning
 Algebra and Trigonometry (MindTap Course List)AlgebraISBN:9781305071742Author:James Stewart, Lothar Redlin, Saleem WatsonPublisher:Cengage Learning
 College AlgebraAlgebraISBN:9781305115545Author:James Stewart, Lothar Redlin, Saleem WatsonPublisher:Cengage Learning
 Big Ideas Math A Bridge To Success Algebra 1: Stu...AlgebraISBN:9781680331141Author:HOUGHTON MIFFLIN HARCOURTPublisher:Houghton Mifflin Harcourt