
Videos
(a)
Interpretation:
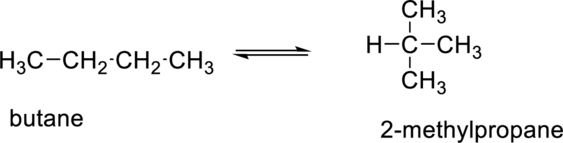
A table of initial concentrations, change in concentrations and equilibrium concentrations for the below given reaction has to be given.
Concept Introduction:
ICE table:
The full form of ICE table is Initial Change Equilibrium table. It is used to solve initial concentrations or pressures in equilibrium reactions.
Reaction Quotient:
Reaction quotient, Q is the ratio between product of the product concentration to the product of the reactant concentration with each term raised to the power of its balancing coefficient.
Consider a general equation,
Where a, b, c and d are the
The concentration of solids and pure liquids do not change, so their concentration terms are not included in the reaction quotient expression.
(b)
Interpretation:
The equilibrium constant expression in terms of x has to be written and then the variable ‘x’ has to be solved for the given reaction.
Concept Introduction:
Equilibrium constant: At equilibrium the ratio of products to reactants (each raised to the power corresponding to its stoichiometric coefficient) has a constant value, K
For a general reaction,
The concentration of solids and pure liquids do not change, so their concentration terms are not included in the equilibrium constant expression.
(c)
Interpretation:
The equilibrium concentration of each isomer of the given reaction under given experimental conditions has to be calculated.
Concept Introduction:
Refer part (b).
Want to see the full answer?
Check out a sample textbook solution
Chapter 12 Solutions
OWLV2 FOR MOORE/STANITSKI'S CHEMISTRY:


- Identify and provide an explanation that distinguishes a qualitative and quantitative chemical analysis. Provide examples.arrow_forwardIdentify and provide an explanation of the operational principles behind a Atomic Absorption Spectrometer (AAS). List the steps involved.arrow_forwardInstructions: Complete the questions in the space provided. Show all your work 1. You are trying to determine the rate law expression for a reaction that you are completing at 25°C. You measure the initial reaction rate and the starting concentrations of the reactions for 4 trials. BrO³¯ (aq) + 5Br¯ (aq) + 6H* (aq) → 3Br₂ (l) + 3H2O (l) Initial rate Trial [BrO3] [H*] [Br] (mol/L) (mol/L) | (mol/L) (mol/L.s) 1 0.10 0.10 0.10 8.0 2 0.20 0.10 0.10 16 3 0.10 0.20 0.10 16 4 0.10 0.10 0.20 32 a. Based on the above data what is the rate law expression? b. Solve for the value of k (make sure to include proper units) 2. The proposed reaction mechanism is as follows: i. ii. BrО¸¯ (aq) + H+ (aq) → HBrO3 (aq) HBrO³ (aq) + H* (aq) → H₂BrO3* (aq) iii. H₂BrO³* (aq) + Br¯ (aq) → Br₂O₂ (aq) + H2O (l) [Fast] [Medium] [Slow] iv. Br₂O₂ (aq) + 4H*(aq) + 4Br(aq) → 3Br₂ (l) + H2O (l) [Fast] Evaluate the validity of this proposed reaction. Justify your answer.arrow_forward
- a. H3C CH3 H, 1.0 equiv. Br2arrow_forwardH3C. H3C CH 3 CH 3 CH3 1. LDA 2. PhSeCl 3. H2O2arrow_forwardPlease predict the products for each of the following reactions: 1.03 2. H₂O NaNH, 1. n-BuLi 2. Mel A H₂ 10 9 0 H2SO4, H₂O HgSO4 Pd or Pt (catalyst) B 9 2 n-BuLi ♡ D2 (deuterium) Lindlar's Catalyst 1. NaNH2 2. EtBr Na, ND3 (deuterium) 2. H₂O2, NaOH 1. (Sia)2BH с Darrow_forward
- in the scope of ontario SCH4U grade 12 course, please show ALL workarrow_forwardIs the chemical reaction CuCl42-(green) + 4H2O <==> Cu(H2O)42+(blue) + 4Cl- exothermic or endothermic?arrow_forwardIf we react tetraethoxypropane with hydrazine, what is the product obtained (explain its formula). State the reason why the corresponding dialdehyde is not used.arrow_forward
 Chemistry: The Molecular ScienceChemistryISBN:9781285199047Author:John W. Moore, Conrad L. StanitskiPublisher:Cengage Learning
 General Chemistry - Standalone book (MindTap Cour...ChemistryISBN:9781305580343Author:Steven D. Gammon, Ebbing, Darrell Ebbing, Steven D., Darrell; Gammon, Darrell Ebbing; Steven D. Gammon, Darrell D.; Gammon, Ebbing; Steven D. Gammon; DarrellPublisher:Cengage Learning
 Principles of Modern ChemistryChemistryISBN:9781305079113Author:David W. Oxtoby, H. Pat Gillis, Laurie J. ButlerPublisher:Cengage Learning
 Chemistry: Principles and PracticeChemistryISBN:9780534420123Author:Daniel L. Reger, Scott R. Goode, David W. Ball, Edward MercerPublisher:Cengage Learning
 Chemistry: Matter and ChangeChemistryISBN:9780078746376Author:Dinah Zike, Laurel Dingrando, Nicholas Hainen, Cheryl WistromPublisher:Glencoe/McGraw-Hill School Pub Co
 Chemistry & Chemical ReactivityChemistryISBN:9781337399074Author:John C. Kotz, Paul M. Treichel, John Townsend, David TreichelPublisher:Cengage Learning