Videos
Characterize a system at
a. the rates of the forward and reverse reactions
b. the overall composition of the reaction mixture For a general reaction
Interpretation: The given systems at equilibrium are to be characterized. For the given reaction, the required plot is to be shown. The plot that illustrates the rate of forward reaction and rate of reverse reaction is to be sketched.
Concept introduction: Chemical equilibrium is a state of a system in which the rate of forward reaction and that of the backward reaction is equal. It is affected by various factors such as concentration of reactants or products, temperature, pressure.
Answer to Problem 1RQ
Answer
- a) Rate of the forward and reverse reactions are equal at equilibrium.
- b) The overall composition remains constant at equilibrium.
The plot of concentrations of A,B and C versus time is shown in Figure 1.
The plot illustrating the rate of forward reaction and rate of reverse reaction versus time is shown in Figure 2.
Explanation of Solution
Explanation
(I)
(a)
To determine: The characterization of the given system at equilibrium.
The rate of the forward and reverse reactions is equal at equilibrium.
At equilibrium, the concentrations of reactants and products do not change. When equilibrium is attained by a system, equilibrium rate of forward reaction will be equal to rate of backward reaction.
(b)
To determine: The characterization of the given system at equilibrium.
The overall composition remains constant at equilibrium.
The forward and backward reaction at equilibrium proceeds with same rate, hence the concentration of reactants and products do not change. Therefore, the overall composition remains constant at equilibrium.
(II)
To determine: The plot of concentrations of A,B and C versus time and the plot illustrating the rate of forward reaction and rate of reverse reaction versus time.
The plot of concentrations of A, B and C versus time is shown in Figure 1.
The given reaction is,
If one starts with only reactants present, then the plot of concentrations of A,B and C versus time will be like,
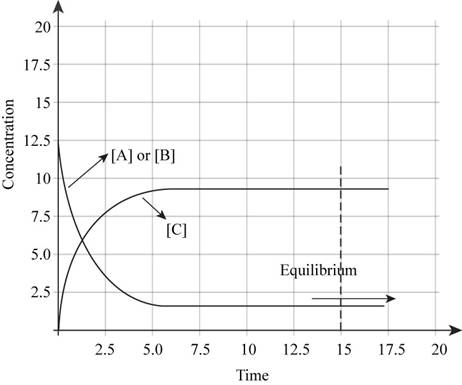
Figure 1
In the beginning of the reaction, the concentration of reactants is more. As the time proceeds, the concentration of reactants decreases and the concentration of products increases. At equilibrium, there is no change in the concentrations of reactants and products.
The plot illustrating the rate of forward reaction and rate of reverse reaction versus time is shown in Figure 2.
In the beginning of the reaction, the concentration of reactants is more. Therefore, rate of forward reaction is high. But as the reaction proceeds further, the reactants are consumed to form products. Hence rate of forward reaction decreases and rate of backward reaction increases. At equilibrium, both the rates are equal. Therefore, plot illustrating the rate of forward reaction and rate of reverse reaction versus time will be like,
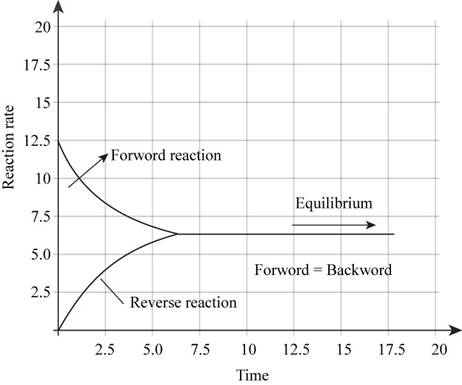
Figure 2
Conclusion
- a) Rate of the forward and reverse reactions are equal at equilibrium.
- b) The overall composition remains constant at equilibrium.
The plot of concentrations of A, B and C versus time is shown in Figure 1.
The plot illustrating the rate of forward reaction and rate of reverse reaction versus time is shown in Figure 2
Want to see more full solutions like this?
Chapter 12 Solutions
Chemistry: An Atoms First Approach


- Determine the structures of the missing organic molecules in the following reaction: X+H₂O H* H+ Y OH OH Note: Molecules that share the same letter have the exact same structure. In the drawing area below, draw the skeletal ("line") structures of the missing organic molecules X and Y. You may draw the structures in any arrangement that you like, so long as they aren't touching. Click and drag to start drawing a structure. X Sarrow_forwardPredict the major products of this organic reaction. If there aren't any products, because nothing will happen, check the box under the drawing area instead. No reaction. HO. O :☐ + G Na O.H Click and drag to start drawing a structure. XS xs H₂Oarrow_forwardWhat are the angles a and b in the actual molecule of which this is a Lewis structure? H H C H- a -H b H Note for advanced students: give the ideal angles, and don't worry about small differences from the ideal groups may have slightly different sizes. a = b = 0 °arrow_forward
- What are the angles a and b in the actual molecule of which this is a Lewis structure? :0: HCOH a Note for advanced students: give the ideal angles, and don't worry about small differences from the ideal that might be caused by the fact that different electron groups may have slightly different sizes. a = 0 b=0° Sarrow_forwardDetermine the structures of the missing organic molecules in the following reaction: + H₂O +H OH O OH +H OH X Note: Molecules that share the same letter have the exact same structure. In the drawing area below, draw the skeletal ("line") structure of the missing organic molecule X. Click and drag to start drawing a structure.arrow_forwardIdentify the missing organic reactant in the following reaction: x + x O OH H* + ☑- X H+ O O Х Note: This chemical equation only focuses on the important organic molecules in the reaction. Additional inorganic or small-molecule reactants or products (like H₂O) are not shown. In the drawing area below, draw the skeletal ("line") structure of the missing organic reactant X. Click and drag to start drawing a structure. Carrow_forward
- CH3O OH OH O hemiacetal O acetal O neither O 0 O hemiacetal acetal neither OH hemiacetal O acetal O neither CH2 O-CH2-CH3 CH3-C-OH O hemiacetal O acetal CH3-CH2-CH2-0-c-O-CH2-CH2-CH3 O neither HO-CH2 ? 000 Ar Barrow_forwardWhat would be the best choices for the missing reagents 1 and 3 in this synthesis? 1. PPh3 2 2. n-BuLi 3 Draw the missing reagents in the drawing area below. You can draw them in any arrangement you like. • Do not draw the missing reagent 2. If you draw 1 correctly, we'll know what it is. • Note: if one of your reagents needs to contain a halogen, use bromine. Explanation Check Click and drag to start drawing a structure.arrow_forwardPredict the products of this organic reaction: NaBH3CN + NH2 ? H+ Click and drag to start drawing a structure. ×arrow_forward
- Predict the organic products that form in the reaction below: + OH +H H+ ➤ ☑ X - Y Note: You may assume you have an excess of either reactant if the reaction requires more than one of those molecules to form the products. In the drawing area below, draw the skeletal ("line") structures of the missing organic products X and Y. You may draw the structures in any arrangement that you like, so long as they aren't touching. Click and drag to start drawing a structure. Garrow_forwardPredict the organic products that form in the reaction below: OH H+ H+ + ☑ Y Note: You may assume you have an excess of either reactant if the reaction requires more than one of those molecules to form the products. In the drawing area below, draw the skeletal ("line") structures of the missing organic products X and Y. You may draw the structures in any arrangement that you like, so long as they aren't touching. Click and drag to start drawing a structure. ✓ marrow_forwardDetermine the structures of the missing organic molecules in the following reaction: + H₂O +H H+ Y Z ☑ ☑ Note: Molecules that share the same letter have the exact same structure. In the drawing area below, draw the skeletal ("line") structures of the missing organic molecules X, Y, and Z. You may draw the structures in any arrangement that you like, so long as they aren't touching. Molecule X shows up in multiple steps, but you only have to draw its structure once. Click and drag to start drawing a structure. AP +arrow_forward
 General, Organic, and Biological ChemistryChemistryISBN:9781285853918Author:H. Stephen StokerPublisher:Cengage Learning
 Chemistry: An Atoms First ApproachChemistryISBN:9781305079243Author:Steven S. Zumdahl, Susan A. ZumdahlPublisher:Cengage Learning
 Chemistry by OpenStax (2015-05-04)ChemistryISBN:9781938168390Author:Klaus Theopold, Richard H Langley, Paul Flowers, William R. Robinson, Mark BlaserPublisher:OpenStax
 Introductory Chemistry: A FoundationChemistryISBN:9781337399425Author:Steven S. Zumdahl, Donald J. DeCostePublisher:Cengage Learning
 World of Chemistry, 3rd editionChemistryISBN:9781133109655Author:Steven S. Zumdahl, Susan L. Zumdahl, Donald J. DeCostePublisher:Brooks / Cole / Cengage Learning