
Videos
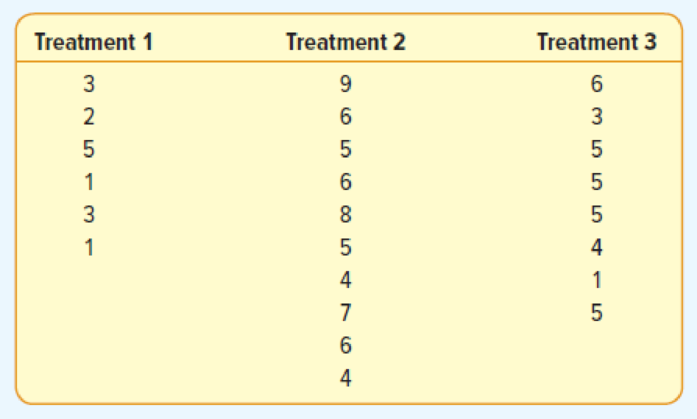
The following are six observations collected from treatment 1, ten observations collected from treatment 2, and eight observations collected from treatment 3. Test the hypothesis that the treatment
- a. State the null hypothesis and the alternate hypothesis.
- b. What is the decision rule?
- c. Compute SST, SSE, and SS total.
- d. Complete an ANOVA table.
- e. State your decision regarding the null hypothesis.
- f. If H0 is rejected, can we conclude that treatment 2 and treatment 3 differ? Use the 95% level of confidence.
a.
Obtain the null and the alternative hypotheses.
Explanation of Solution
The null and alternative hypotheses are given below:
Null Hypothesis
That is, mean of all treatments are equal.
Alternative Hypothesis
b.
Give the decision rule.
Explanation of Solution
The treatment and error degrees of freedom are given below:
Treatment degrees of freedom:
Error degrees of freedom:
The critical F value is as follows:
Here, the level of significance
Step-by-step procedure to obtain the critical F value using Excel-MegaStat:
- In EXCEL, Select Add-Ins > MegaStat > Probability.
- Choose probability> F-distribution> calculate F given probability.
- Enter P as 0.05.
- Enter df1 as 2.
- Enter df2 as 21.
- Click Ok.
Output using the Excel-MegaStat software is given below:
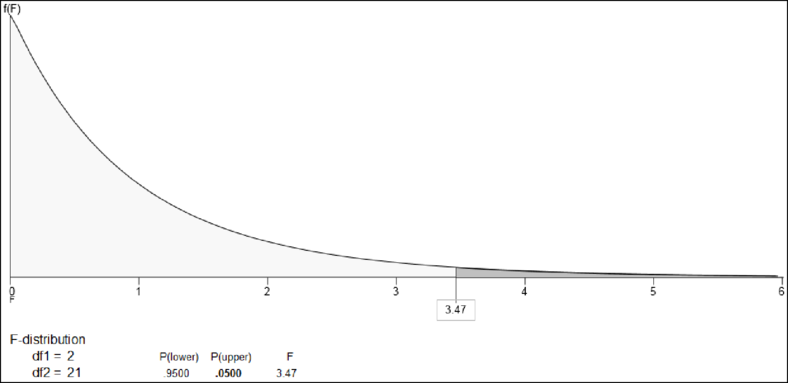
From the output, the critical F value is 3.47.
Decision rule:
If
Therefore, the decision rule is to reject
c.
Find the values of SST, SSE and SS total.
Answer to Problem 12E
The value of SST is 46.96.
The value of SSE is 53.00.
The value of SS total is 99.96.
Explanation of Solution
Here, the level of significance
Step-by-step procedure to obtain the sum of square total, sum of square treatment and sum of square error using Excel-MegaStat:
- Choose MegStat > Analysis of Variance > One-Factor ANOVA.
- Select the column of Treatment 1, Treatment 2 and Treatment 3 in Input range.
- Click OK.
Output using the Excel-MegaStat software is given below:
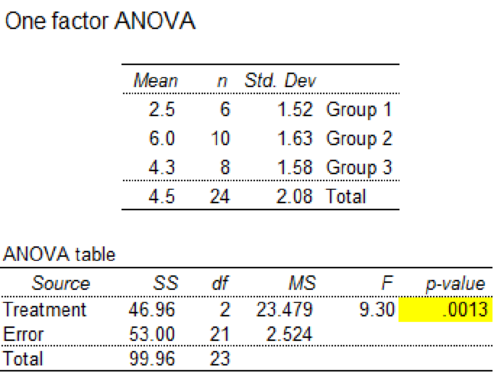
From the output, the values of SST is 46.96, SSE is 53.00 and SS total is 99.96.
d.
Find an ANOVA table.
Explanation of Solution
From the output in Part (c), the ANOVA table is obtained.
The ANOVA table is given below:
| Source of Variation | Sum of Squares | Degrees of Freedom | Mean Square | F |
| Treatments | 46.96 | 2 | 23.48 | 9.3 |
| Error | 53 | 21 | 2.52 | |
| Total | 99.96 | 23 |
e.
Find the decision regarding the null hypothesis.
Explanation of Solution
Conclusion:
The F value is 9.30 and the F critical value is 3.47.
Here, F value is greater than F critical value. That is, 9.30 > 3.47.
Using rejection rule, reject the null hypothesis.
Therefore, there is sufficient evidence that at least one treatment mean is different from others.
f.
Check whether there is significant difference between treatment 2 and treatment 3, if null hypothesis is rejected by using the 95% level of confidence.
Explanation of Solution
A 95% confidence interval is as follows:
Where,
From the output in Part (c), mean of treatment 2 is 6, mean of treatment 3 is 4.3, and MSE is 2.524.
Step-by-step procedure to obtain t-critical value using Excel-MegaStat:
- In EXCEL, Select Add-Ins > MegaStat > Probability > t-Distribution.
- Select calculate t given P.
- Enter probability as 0.05.
- Enter df as 21.
- Under Shading, choose two-tail.
- Click Ok.
Output using the Excel-MegaStat software is given below:
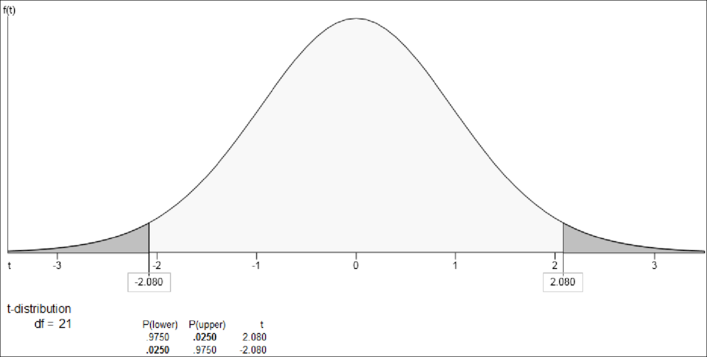
From the output, the t is
Therefore, a 95% confidence interval for that difference is 0.14 and 3.26. Here, 0 does not lie in the confidence interval. It means that there is a significant difference between the means of treatment 2 and treatment 3.
Want to see more full solutions like this?
Chapter 12 Solutions
Gen Combo Ll Statistical Techniques In Business And Economics; Connect Ac


- 10. Prove that, if (t)=1+0(12) as asf->> O is a characteristic function, then p = 1.arrow_forward9. The concentration function of a random variable X is defined as Qx(h) sup P(x ≤x≤x+h), h>0. (b) Is it true that Qx(ah) =aQx (h)?arrow_forward3. Let X1, X2,..., X, be independent, Exp(1)-distributed random variables, and set V₁₁ = max Xk and W₁ = X₁+x+x+ Isk≤narrow_forward
- 7. Consider the function (t)=(1+|t|)e, ER. (a) Prove that is a characteristic function. (b) Prove that the corresponding distribution is absolutely continuous. (c) Prove, departing from itself, that the distribution has finite mean and variance. (d) Prove, without computation, that the mean equals 0. (e) Compute the density.arrow_forward1. Show, by using characteristic, or moment generating functions, that if fx(x) = ½ex, -∞0 < x < ∞, then XY₁ - Y2, where Y₁ and Y2 are independent, exponentially distributed random variables.arrow_forward1. Show, by using characteristic, or moment generating functions, that if 1 fx(x): x) = ½exarrow_forward
- 1990) 02-02 50% mesob berceus +7 What's the probability of getting more than 1 head on 10 flips of a fair coin?arrow_forward9. The concentration function of a random variable X is defined as Qx(h) sup P(x≤x≤x+h), h>0. = x (a) Show that Qx+b(h) = Qx(h).arrow_forwardSuppose that you buy a lottery ticket, and you have to pick six numbers from 1 through 50 (repetitions allowed). Which combination is more likely to win: 13, 48, 17, 22, 6, 39 or 1, 2, 3, 4, 5, 6? barrow_forward
- 2 Make a histogram from this data set of test scores: 72, 79, 81, 80, 63, 62, 89, 99, 50, 78, 87, 97, 55, 69, 97, 87, 88, 99, 76, 78, 65, 77, 88, 90, and 81. Would a pie chart be appropriate for this data? ganizing Quantitative Data: Charts and Graphs 45arrow_forward10 Meteorologists use computer models to predict when and where a hurricane will hit shore. Suppose they predict that hurricane Stat has a 20 percent chance of hitting the East Coast. a. On what info are the meteorologists basing this prediction? b. Why is this prediction harder to make than your chance of getting a head on your next coin toss? U anoiaarrow_forward6. Show that one cannot find independent, identically distributed random variables X and Y such that X-YE U(-1, 1). 7 Consider al onarrow_forward
 Glencoe Algebra 1, Student Edition, 9780079039897...AlgebraISBN:9780079039897Author:CarterPublisher:McGraw Hill
 College Algebra (MindTap Course List)AlgebraISBN:9781305652231Author:R. David Gustafson, Jeff HughesPublisher:Cengage Learning