
Videos
a.
Obtain the null and the alternative hypotheses.
a.
Explanation of Solution
The null and alternative hypotheses are given below:
Null Hypothesis
That is, the
Alternative Hypothesis
b.
Give the decision rule.
b.
Explanation of Solution
The treatment and error degrees of freedom are given below:
Treatment degrees of freedom:
Error degrees of freedom:
Here, the level of significance
Step-by-step procedure to obtain the critical F value using Excel-MegaStat:
- In EXCEL, Select Add-Ins > MegaStat > Probability.
- Choose probability> F-distribution> calculate F given probability.
- Enter P as 0.05.
- Enter df1 as 2.
- Enter df2 as 9.
- Click Ok.
Output using the Excel-MegaStat software is given below:
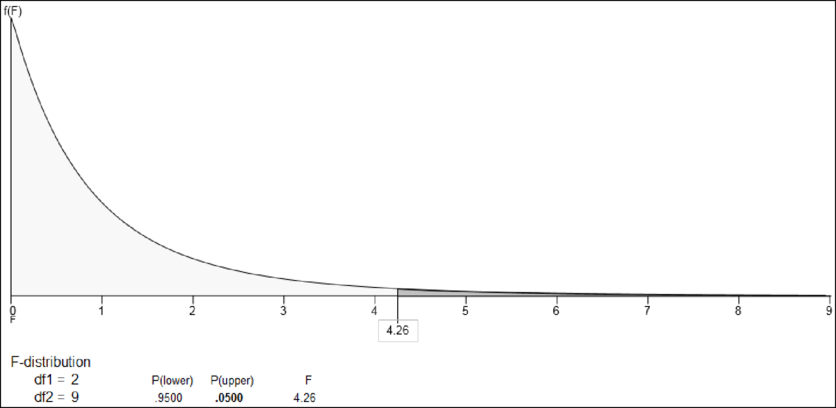
From the output, the critical F value is 4.26.
Decision rule:
If
Therefore, the decision rule is to reject
c.
Find the values of SST, SSE and SS total.
c.
Answer to Problem 11E
The value of SST is 107.20.
The value of SSE is 9.47.
The value of SS total is 116.67.
Explanation of Solution
Here, the level of significance
Step-by-step procedure to obtain the sum of square total, sum of square treatment and sum of square error using Excel-MegaStat:
- Choose MegStat > Analysis of Variance > One-Factor ANOVA.
- Select the column of Treatment 1, Treatment 2 and Treatment 3 in Input
range . - Click OK.
Output using the Excel-MegaStat software is given below:
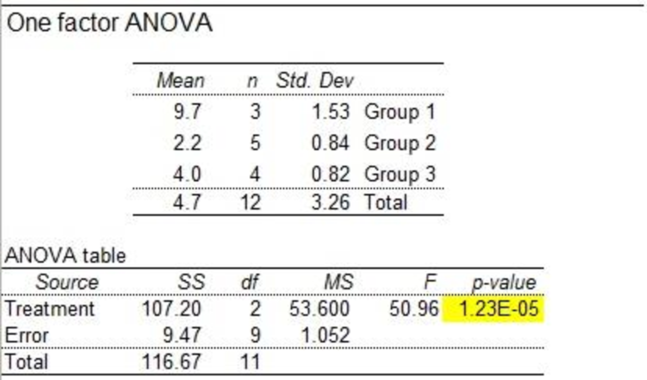
From the output, the values of SST is 107.20, SSE is 9.47 and SS total is 116.67.
d.
Find an ANOVA table.
d.
Explanation of Solution
From the output in Part (c), the ANOVA table is obtained.
The ANOVA table is given below:
| Source of Variation | Sum of Squares | Degrees of Freedom | Mean Square | F |
| Treatments | 107.2 | 2 | 53.6 | 50.96 |
| Error | 9.47 | 9 | 1.05 | |
| Total | 116.67 | 11 |
e.
Find the decision regarding the null hypothesis.
e.
Explanation of Solution
Conclusion:
The F value is 50.96 and the F critical value is 4.26.
Here, F value is greater than F critical value. That is, 50.96 > 4.26.
Using rejection rule, reject the null hypothesis.
Therefore, there is sufficient evidence that at least one mean of all treatment is differ from others.
f.
Check whether there is significant difference between treatment 1 and treatment 2, if null hypothesis is rejected by using the 95% level of confidence.
f.
Explanation of Solution
A 95% confidence interval is as follows:
Where,
From the output in Part (c), the mean of treatment 1 is 9.7, mean of treatment 2 is 2.2, and MSE is 1.052.
Step-by-step procedure to obtain t-critical value using Excel-MegaStat:
- In EXCEL, Select Add-Ins > MegaStat > Probability > t-Distribution.
- Select calculate t given P.
- Enter probability as 0.05.
- Enter df as 9.
- Under Shading, choose two-tail.
- Click Ok.
Output using the Excel-MegaStat software is given below:
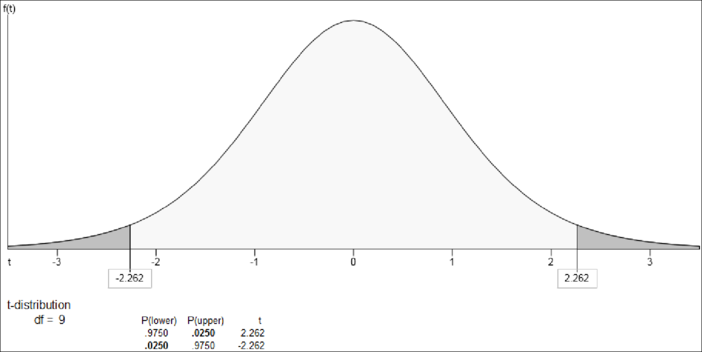
From the output, the t is
Therefore, a 95% confidence interval for that difference is 5.8 and 9.2. Here, 0 does not include in the confidence interval.
It means that there is a significant difference between the means of treatment 1 and treatment 2 because the endpoints have same sign or does not include zero.
Want to see more full solutions like this?
Chapter 12 Solutions
Gen Combo Ll Statistical Techniques In Business And Economics; Connect Ac


- A company found that the daily sales revenue of its flagship product follows a normal distribution with a mean of $4500 and a standard deviation of $450. The company defines a "high-sales day" that is, any day with sales exceeding $4800. please provide a step by step on how to get the answers in excel Q: What percentage of days can the company expect to have "high-sales days" or sales greater than $4800? Q: What is the sales revenue threshold for the bottom 10% of days? (please note that 10% refers to the probability/area under bell curve towards the lower tail of bell curve) Provide answers in the yellow cellsarrow_forwardFind the critical value for a left-tailed test using the F distribution with a 0.025, degrees of freedom in the numerator=12, and degrees of freedom in the denominator = 50. A portion of the table of critical values of the F-distribution is provided. Click the icon to view the partial table of critical values of the F-distribution. What is the critical value? (Round to two decimal places as needed.)arrow_forwardA retail store manager claims that the average daily sales of the store are $1,500. You aim to test whether the actual average daily sales differ significantly from this claimed value. You can provide your answer by inserting a text box and the answer must include: Null hypothesis, Alternative hypothesis, Show answer (output table/summary table), and Conclusion based on the P value. Showing the calculation is a must. If calculation is missing,so please provide a step by step on the answers Numerical answers in the yellow cellsarrow_forward
 Glencoe Algebra 1, Student Edition, 9780079039897...AlgebraISBN:9780079039897Author:CarterPublisher:McGraw Hill
 College Algebra (MindTap Course List)AlgebraISBN:9781305652231Author:R. David Gustafson, Jeff HughesPublisher:Cengage Learning