
Concept explainers
Videos
a.
Obtain the null and the alternative hypotheses.
a.
Explanation of Solution
Denote
The null and alternative hypotheses are given below:
Null Hypothesis
All the means of tuition rates for the various regions are equal.
Alternative Hypothesis
b.
Give the decision rule.
b.
Explanation of Solution
The degrees of freedom for the numerator is obtained as given below:
The degrees of freedom for the denominator is obtained as given below:
The critical F value is as follows:
Here, the test is one-tailed and the level of significance
Use Table - B.6A Critical Values of the F Distribution (α = .05) to obtained critical F value.
- Locate 2 in the column of Degrees of Freedom for the Numerator
- Locate 11 in the row of Degrees of Freedom for the Denominator
- The intersection of row and column is 3.98
Thus, the critical F value is 3.98.
Decision rule:
If
Therefore, the decision rule is reject
c.
Obtain an ANOVA table.
Find the value of the test statistic.
c.
Answer to Problem 3SR
The ANOVA table is,
| Source of Variation | Sum of Squares | Degrees of Freedom | Mean Square | F |
| Treatments | 44.16 | 2 | 22.082 | 25.43 |
| Error | 9.55 | 11 | 0.868 | |
| Total | 53.71 | 13 |
The value of the test statistics is 25.43.
Explanation of Solution
Here, the level of significance
Step-by-step procedure to obtain ANOVA table using Excel-MegaStat:
- In EXCEL, Select Add-Ins > Mega Stat > Analysis of Variance.
- Choose One-Factor ANOVA.
- In Input
Range , enter the column of Northeast, Southeast and West. - Choose When p < 0.05.
- Click OK.
Output using the Excel-MegaStat software is given below:
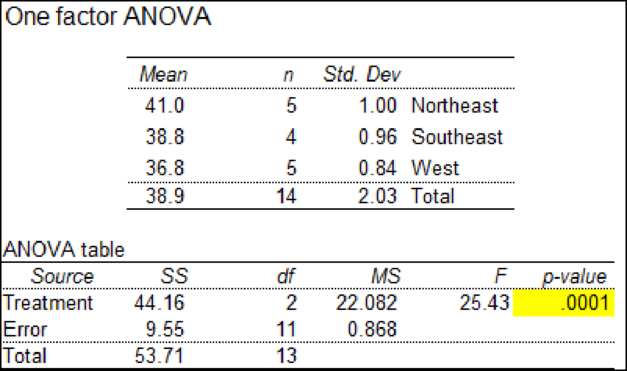
From the output, the ANOVA table is obtained as given below:
| Source of Variation | Sum of Squares | Degrees of Freedom | Mean Square | F |
| Treatments | 44.16 | 2 | 22.082 | 25.43 |
| Error | 9.55 | 11 | 0.868 | |
| Total | 53.71 | 13 |
From the output, the value of the test statistics is 25.43.
d.
Find the decision regarding the null hypothesis.
d.
Answer to Problem 3SR
The null hypothesis is rejected.
Explanation of Solution
Decision:
The F value is 25.43 and the F critical value is 3.98.
Here, F value is greater than F critical value. That is, 25.43 > 3.98.
Using decision rule, reject the null hypothesis.
The decision is, reject the null hypothesis because the computed F value (25.43) is greater than the F critical value (3.81).
Thus, the null hypothesis
Therefore, there is sufficient evidence that there is a difference in the mean tuition rates for the various regions.
e.
Check if there be a significant difference between the mean tuition in the Northeast and that of the West.
Construct a 95% confidence interval for the difference.
e.
Answer to Problem 3SR
There be a significant difference between the mean tuition in the Northeast and that of the West.
A 95% confidence interval for the difference is 2.9 and 5.5.
Explanation of Solution
A 95% confidence interval is as follows:
Where,
Step-by-step procedure to obtain ANOVA table using Excel-MegaStat:
- In EXCEL, Select Add-Ins > Mega Stat > Analysis of Variance.
- Choose One-Factor ANOVA.
- In Input Range, enter the column of Northeast, Southeast and West.
- In Post-Hoc Analysis, Choose When p < 0.05.
- Click OK.
Output using the Excel-MegaStat software is given below:
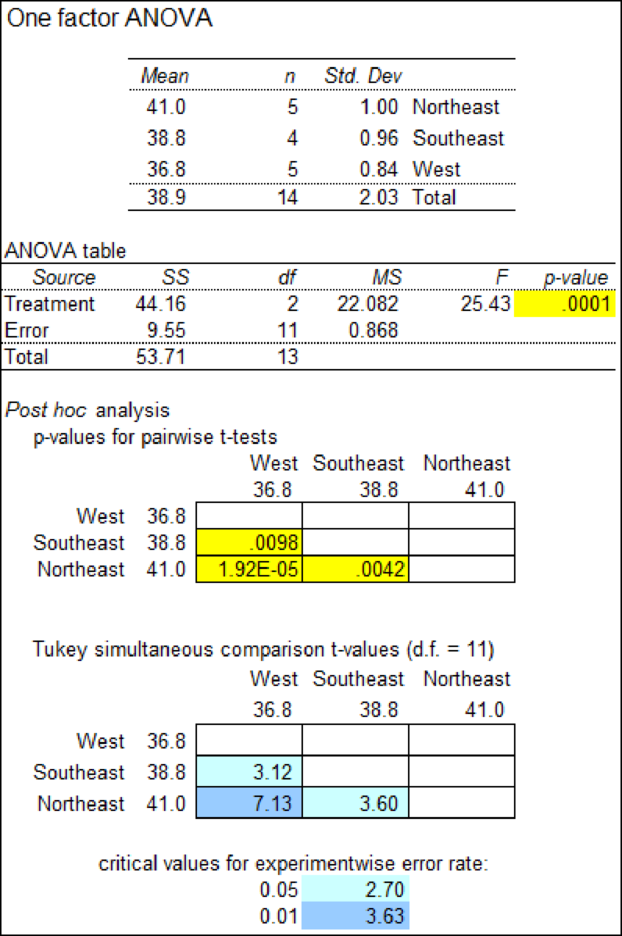
From the output, mean of northwest is 41, mean of west is 36.8, and MSE is 0.868.
The value of t is as follows:
Step-by-step procedure to obtain ANOVA table using Excel-MegaStat:
- In EXCEL, Select Add-Ins > MegaStat > Probability.
- Choose Continuous probability distributions.
- Select t-distribution and select calculate t given probability and enter probability as 0.05.
- Enter df as 11.
- Click Ok.
Output using the Excel-MegaStat software is given below:
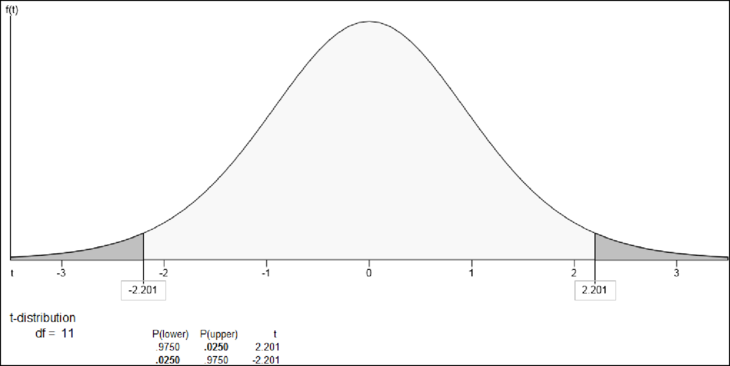
From the output, the t is
Therefore, a 95% confidence interval for the difference is between 2.9 and 5.5. Both the end points are positive and does not include zero. Thus, there is a significant difference between the mean tuition rates in the Northeast and that of the West.
Thus, the 95% confidence interval for the difference is 2.9 and 5.5.
Want to see more full solutions like this?
Chapter 12 Solutions
Gen Combo Ll Statistical Techniques In Business And Economics; Connect Ac


- A company found that the daily sales revenue of its flagship product follows a normal distribution with a mean of $4500 and a standard deviation of $450. The company defines a "high-sales day" that is, any day with sales exceeding $4800. please provide a step by step on how to get the answers in excel Q: What percentage of days can the company expect to have "high-sales days" or sales greater than $4800? Q: What is the sales revenue threshold for the bottom 10% of days? (please note that 10% refers to the probability/area under bell curve towards the lower tail of bell curve) Provide answers in the yellow cellsarrow_forwardFind the critical value for a left-tailed test using the F distribution with a 0.025, degrees of freedom in the numerator=12, and degrees of freedom in the denominator = 50. A portion of the table of critical values of the F-distribution is provided. Click the icon to view the partial table of critical values of the F-distribution. What is the critical value? (Round to two decimal places as needed.)arrow_forwardA retail store manager claims that the average daily sales of the store are $1,500. You aim to test whether the actual average daily sales differ significantly from this claimed value. You can provide your answer by inserting a text box and the answer must include: Null hypothesis, Alternative hypothesis, Show answer (output table/summary table), and Conclusion based on the P value. Showing the calculation is a must. If calculation is missing,so please provide a step by step on the answers Numerical answers in the yellow cellsarrow_forward
 Glencoe Algebra 1, Student Edition, 9780079039897...AlgebraISBN:9780079039897Author:CarterPublisher:McGraw Hill
 College Algebra (MindTap Course List)AlgebraISBN:9781305652231Author:R. David Gustafson, Jeff HughesPublisher:Cengage Learning