
To calculate: The mean and standard deviation of given data set and also find the number of data values between one standard deviation from the mean, within two standard deviations from the mean, and within three standard deviations from the mean and explain how a graph help to describe how many standard deviations a data value is from the mean.
The mean and standard deviation of the given data is 53.8 and 3.60 respectively and the points
Given:
The data for daily energy usage of a small town in 10 days in June is shown below
| 51.8 MWh | 53.6 MWh | 54.7 MWh | 51.9 MWh | 49.3 MWh |
| 52.0 MWh | 53.5 MWh | 51.2 MWh | 60.7 MWh | 59.3 MWh |
Formula used:
The formula used to calculate the mean and standard deviation are shown below?
Calculation:
The mean of the given data is calculated as shown below
The standard deviation is the average of the deviations of all data points from the mean and is calculated using the following table
| X | ||
| 51.8 | 4 | |
| 53.6 | 0.04 | |
| 54.7 | 0.81 | |
| 51.9 | 3.61 | |
| 49.3 | 20.25 | |
| 52 | 3.24 | |
| 53.5 | 0.09 | |
| 51.2 | 6.76 | |
| 60.7 | 47.61 | |
| 59.3 | 30.25 |
The summation of squared deviations from the mean is calculated as shown below
The standard deviation is calculated as shown below
The one, two and three standard deviations from the mean data points are calculated as shown below
Thus with reference to given data points, within one standard deviation of mean there are 7 data points and within two and three standard deviation of mean there are all 10 data points.
The graph of the standard normal curve has Z scores and the probabilities, Z score is the number of standard deviations of a data point from mean. The standard normal curve is shown below
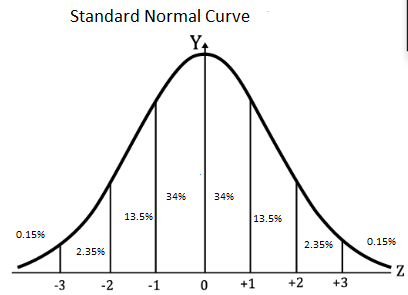
With reference to Z scores and their probabilities, the number of data points within given standard deviations of mean can be determined using the graph.
Chapter 11 Solutions
High School Math 2015 Common Core Algebra 2 Student Edition Grades 10/11

- please Solve questions by Course Name( Ordinary Differential Equations II 2)arrow_forwardInThe Northern Lights are bright flashes of colored light between 50 and 200 miles above Earth. Suppose a flash occurs 150 miles above Earth. What is the measure of arc BD, the portion of Earth from which the flash is visible? (Earth’s radius is approximately 4000 miles.)arrow_forwarde). n! (n - 1)!arrow_forward
- Suppose you flip a fair two-sided coin four times and record the result. a). List the sample space of this experiment. That is, list all possible outcomes that could occur when flipping a fair two-sided coin four total times. Assume the two sides of the coin are Heads (H) and Tails (T).arrow_forwarde). n! (n - 1)!arrow_forwardEvaluate the following expression and show your work to support your calculations. a). 6! b). 4! 3!0! 7! c). 5!2! d). 5!2! e). n! (n - 1)!arrow_forward
 Algebra and Trigonometry (6th Edition)AlgebraISBN:9780134463216Author:Robert F. BlitzerPublisher:PEARSON
 Contemporary Abstract AlgebraAlgebraISBN:9781305657960Author:Joseph GallianPublisher:Cengage Learning
 Linear Algebra: A Modern IntroductionAlgebraISBN:9781285463247Author:David PoolePublisher:Cengage Learning
 Algebra And Trigonometry (11th Edition)AlgebraISBN:9780135163078Author:Michael SullivanPublisher:PEARSON
 Introduction to Linear Algebra, Fifth EditionAlgebraISBN:9780980232776Author:Gilbert StrangPublisher:Wellesley-Cambridge Press
 College Algebra (Collegiate Math)AlgebraISBN:9780077836344Author:Julie Miller, Donna GerkenPublisher:McGraw-Hill Education