
Concept explainers
Videos
(a)
To find: The probability that the customer is on hold less than 30 minutes.
(a)
Answer to Problem 13E
The probability that the customer is on hold less than 30 minutes is
Explanation of Solution
Given:
The expression for the probability is
Calculation:
Consider the given model is,
Then,
(b)
To find: The amount of the time after which 50% customer are served.
(b)
Answer to Problem 13E
The graph is shown in Figure 4 and it shows that after 0.02 hours 1.2 min the customers are served.
Explanation of Solution
Given:
The average calls are 34 calls per hour.
Calculation:
The average call is 34 then the model is,
By the use graphing utility press Y= and enter the model in the calculator as shown in Figure 1
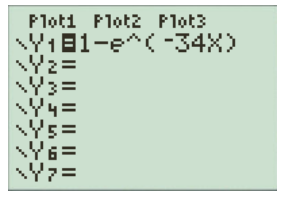
Figure 1
Press the window button and input the parameters as shown in Figure 2
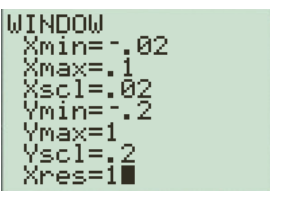
Figure 2
The graph for the given model is shown in Figure 3 and is obtained by pressing the graph button.
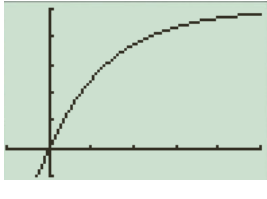
Figure 3
Press the graph button trace a point on the graph as shown in Figure 4
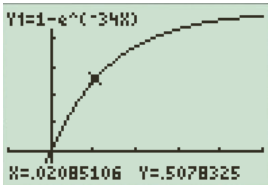
Figure 4
Thus, the graph is shown in Figure 4 and it shows that after 0.02 hours 1.2 min the customers are served.
Chapter 11 Solutions
Advanced Mathematical Concepts: Precalculus with Applications, Student Edition
Additional Math Textbook Solutions
Pre-Algebra Student Edition
University Calculus: Early Transcendentals (4th Edition)
A First Course in Probability (10th Edition)
A Problem Solving Approach To Mathematics For Elementary School Teachers (13th Edition)


- 3. Use the method of washers to find the volume of the solid that is obtained when the region between the graphs f(x) = √√2 and g(x) = secx over the interval ≤x≤ is rotated about the x-axis.arrow_forward4. Use cylindrical shells to find the volume of the solid generated when the region enclosed by the given curves is revolved about the x-axis. y = √√x, y = 0, y = √√3arrow_forward5 4 3 21 N -5-4-3-2 -1 -2 -3 -4 1 2 3 4 5 -5+ Write an equation for the function graphed above y =arrow_forward
- 6 5 4 3 2 1 -5 -4-3-2-1 1 5 6 -1 23 -2 -3 -4 -5 The graph above is a transformation of the function f(x) = |x| Write an equation for the function graphed above g(x) =arrow_forwardThe graph of y x² is shown on the grid. Graph y = = (x+3)² – 1. +10+ 69 8 7 5 4 9 432 6. 7 8 9 10 1 10 -9 -8 -7 -6 -5 -4 -3 -2 -1 1 2 3 4 5 -2 -3 -4 -5 -6- Clear All Draw:arrow_forwardSketch a graph of f(x) = 2(x − 2)² − 3 4 3 2 1 5 ས་ -5 -4 -3 -2 -1 1 2 3 4 -1 -2 -3 -4 -5+ Clear All Draw:arrow_forward
- 5. Find the arc length of the curve y = 3x³/2 from x = 0 to x = 4.arrow_forward-6 -5 * 10 8 6 4 2 -2 -1 -2 1 2 3 4 5 6 -6 -8 -10- The function graphed above is: Concave up on the interval(s) Concave down on the interval(s) There is an inflection point at:arrow_forward6 5 4 3 2 1 -6 -5 -3 -2 3 -1 -2 -3 -4 -5 The graph above is a transformation of the function x² Write an equation for the function graphed above g(x) =arrow_forward
- 6 5 4 3 2 1 -1 -1 -2 -3 -4 A -5 -6- The graph above shows the function f(x). The graph below shows g(x). 6 5 4 3 2 1 3 -1 -2 -3 -4 -5 -6 | g(x) is a transformation of f(x) where g(x) = Af(Bx) where: A = B =arrow_forward5+ 4 3 2 1. -B -2 -1 1 4 5 -1 -2 -3 -4 -5 Complete an equation for the function graphed above y =arrow_forward60 फं + 2 T 2 -2 -3 2 4 5 6 The graph above shows the function f(x). The graph below shows g(x). फ 3 -1 -2 2 g(x) is a transformation of f(x) where g(x) = Af(Bx) where: A = B =arrow_forward
 Calculus: Early TranscendentalsCalculusISBN:9781285741550Author:James StewartPublisher:Cengage Learning
 Thomas' Calculus (14th Edition)CalculusISBN:9780134438986Author:Joel R. Hass, Christopher E. Heil, Maurice D. WeirPublisher:PEARSON
 Calculus: Early Transcendentals (3rd Edition)CalculusISBN:9780134763644Author:William L. Briggs, Lyle Cochran, Bernard Gillett, Eric SchulzPublisher:PEARSON
 Calculus: Early TranscendentalsCalculusISBN:9781319050740Author:Jon Rogawski, Colin Adams, Robert FranzosaPublisher:W. H. Freeman
 Calculus: Early Transcendental FunctionsCalculusISBN:9781337552516Author:Ron Larson, Bruce H. EdwardsPublisher:Cengage Learning