
Videos
Graph the exponential function or inequality.
Answer to Problem 25SGA

Explanation of Solution
Given information:
Calculation:
Here, we will consider the following:
Now, we will find the values of
Now, we will plot the points on the graph. Connect the points to graph the function
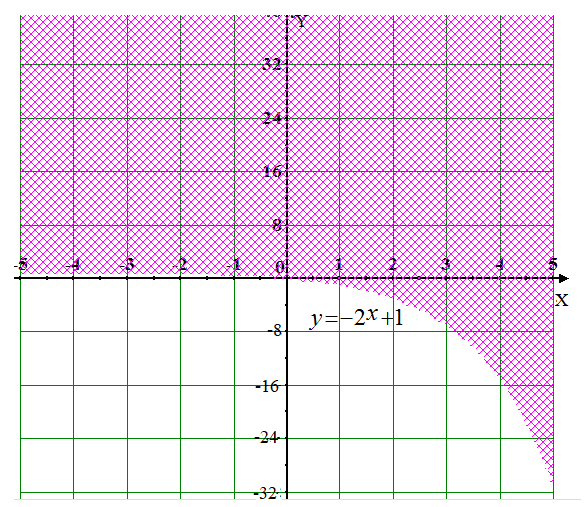
Now, we will consider the point
Hence, the results are shown in the above graph.
Chapter 11 Solutions
Advanced Mathematical Concepts: Precalculus with Applications, Student Edition
Additional Math Textbook Solutions
Basic Business Statistics, Student Value Edition
Elementary Statistics (13th Edition)
Introductory Statistics
Elementary Statistics: Picturing the World (7th Edition)
Calculus: Early Transcendentals (2nd Edition)


- Find all solutions for v when v5 - 3q = 0.arrow_forwardHow would i solve this. More info is that b =1 but it might be better to solve this before making the substitutionarrow_forwardLet m(t) be a continuous function with a domain of all real numbers. The table below shows some of the values of m(t) . Assume the characteristics of this function are represented in the table. t -3 -2 8 11 12 m(t) -7 6 3 -9 0 (a) The point (-3, -7) is on the graph of m(t). Find the corresponding point on the graph of the transformation y = -m(t) + 17. (b) The point (8, 3) is on the graph of m(t). Find the corresponding point on the graph of the transformation y = -m (−t) . 24 (c) Find f(12), if we know that f(t) = |m (t − 1)| f(12) =arrow_forward
- Suppose the number of people who register to attend the Tucson Festival of Books can be modeled by P(t) = k(1.1), where t is the number of days since the registration window opened. Assume k is a positive constant. Which of the following represents how long it will take in days for the number of people who register to double? t = In(1.1) In(2) In(2) t = In(1.1) In(1.1) t = t = t = In(2) - In(k) In(2) In(k) + In(1.1) In(2) - In(k) In(1.1)arrow_forwardUse the method of washers to find the volume of the solid that is obtained when the region between the graphs f(x) = √√2 and g(x) = secx over the interval ≤x≤ is rotated about the x-axis.arrow_forward5 Use the method of disks to find the volume of the solid that is obtained when the region under the curve y = over the interval [4,17] is rotated about the x-axis.arrow_forward
- 3. Use the method of washers to find the volume of the solid that is obtained when the region between the graphs f(x) = √√2 and g(x) = secx over the interval ≤x≤ is rotated about the x-axis.arrow_forward4. Use cylindrical shells to find the volume of the solid generated when the region enclosed by the given curves is revolved about the x-axis. y = √√x, y = 0, y = √√3arrow_forward5 4 3 21 N -5-4-3-2 -1 -2 -3 -4 1 2 3 4 5 -5+ Write an equation for the function graphed above y =arrow_forward
- 6 5 4 3 2 1 -5 -4-3-2-1 1 5 6 -1 23 -2 -3 -4 -5 The graph above is a transformation of the function f(x) = |x| Write an equation for the function graphed above g(x) =arrow_forwardThe graph of y x² is shown on the grid. Graph y = = (x+3)² – 1. +10+ 69 8 7 5 4 9 432 6. 7 8 9 10 1 10 -9 -8 -7 -6 -5 -4 -3 -2 -1 1 2 3 4 5 -2 -3 -4 -5 -6- Clear All Draw:arrow_forwardSketch a graph of f(x) = 2(x − 2)² − 3 4 3 2 1 5 ས་ -5 -4 -3 -2 -1 1 2 3 4 -1 -2 -3 -4 -5+ Clear All Draw:arrow_forward
 Calculus: Early TranscendentalsCalculusISBN:9781285741550Author:James StewartPublisher:Cengage Learning
 Thomas' Calculus (14th Edition)CalculusISBN:9780134438986Author:Joel R. Hass, Christopher E. Heil, Maurice D. WeirPublisher:PEARSON
 Calculus: Early Transcendentals (3rd Edition)CalculusISBN:9780134763644Author:William L. Briggs, Lyle Cochran, Bernard Gillett, Eric SchulzPublisher:PEARSON
 Calculus: Early TranscendentalsCalculusISBN:9781319050740Author:Jon Rogawski, Colin Adams, Robert FranzosaPublisher:W. H. Freeman
 Calculus: Early Transcendental FunctionsCalculusISBN:9781337552516Author:Ron Larson, Bruce H. EdwardsPublisher:Cengage Learning