
Elementary Statistics (13th Edition)
13th Edition
ISBN: 9780134462455
Author: Mario F. Triola
Publisher: PEARSON
expand_more
expand_more
format_list_bulleted
Concept explainers
Videos
Textbook Question
Chapter 11.2, Problem 6BSC
In Exercises 5-18, test the given claim.
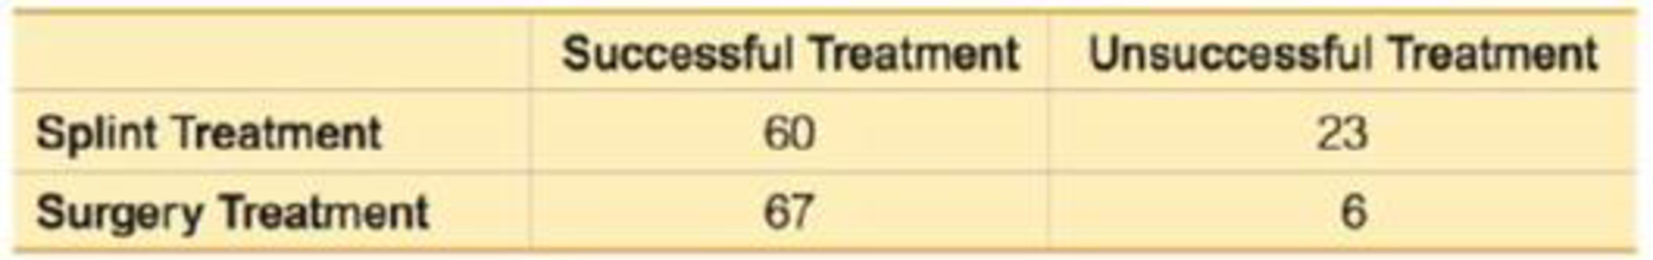
6. Splint or Surgery? A randomized controlled trial was designed to compare the effectiveness of splinting versus surgery in the treatment of carpal tunnel syndrome. Results are given in the table below (based on data from “Splinting vs. Surgery in the Treatment of Carpal Tunnel Syndrome,” by Gerritsen et al., Journal of the American Medical Association, Vol. 288, No. 10). The results are based on evaluations made one year after the treatment. Using a 0.01 significance level, test the claim that success is independent of the type of treatment. What do the results suggest about treating carpal tunnel syndrome?
Expert Solution & Answer
Want to see the full answer?
Check out a sample textbook solution
Students have asked these similar questions
A retail chain is interested in determining whether a digital video point-of-purchase (POP) display would stimulate higher sales for a brand advertised compared to the standard cardboard point-of-purchase display. To test this, a one-shot static group design experiment was conducted over a four-week period in 100 different stores. Fifty stores were randomly assigned to the control treatment (standard display) and the other 50 stores were randomly assigned to the experimental treatment (digital display). Compare the sales of the control group (standard POP) to the experimental group (digital POP).
What were the average sales for the standard POP display (control group)?
What were the sales for the digital display (experimental group)?
What is the (mean) difference in sales between the experimental group and control group?
List the null hypothesis being tested.
Do you reject or retain the null hypothesis based on the results of the independent t-test?
Was the difference between the…
What were the average sales for the four weeks prior to the experiment?
What were the sales during the four weeks when the stores used the digital display?
What is the mean difference in sales between the experimental and regular POP time periods?
State the null hypothesis being tested by the paired sample t-test.
Do you reject or retain the null hypothesis?
At a 95% significance level, was the difference significant? Explain why or why not using the results from the paired sample t-test.
Should the manager of the retail chain install new digital displays in each store? Justify your answer.
A retail chain is interested in determining whether a digital video point-of-purchase (POP) display would stimulate higher sales for a brand advertised compared to the standard cardboard point-of-purchase display. To test this, a one-shot static group design experiment was conducted over a four-week period in 100 different stores. Fifty stores were randomly assigned to the control treatment (standard display) and the other 50 stores were randomly assigned to the experimental treatment (digital display). Compare the sales of the control group (standard POP) to the experimental group (digital POP).
What were the average sales for the standard POP display (control group)?
What were the sales for the digital display (experimental group)?
What is the (mean) difference in sales between the experimental group and control group?
List the null hypothesis being tested.
Do you reject or retain the null hypothesis based on the results of the independent t-test?
Was the difference between the…
Chapter 11 Solutions
Elementary Statistics (13th Edition)
Ch. 11.1 - Cybersecurity The table below lists leading digits...Ch. 11.1 - 2. Cybersecurity When using the data from Exercise...Ch. 11.1 - Cybersecurity The accompanying Statdisk results...Ch. 11.1 - Cybersecurity What do the results from the...Ch. 11.1 - In Exercises 520, conduct the hypothesis test and...Ch. 11.1 - In Exercises 520, conduct the hypothesis test and...Ch. 11.1 - In Exercises 520, conduct the hypothesis test and...Ch. 11.1 - In Exercises 520, conduct the hypothesis test and...Ch. 11.1 - In Exercises 520, conduct the hypothesis test and...Ch. 11.1 - In Exercises 520, conduct the hypothesis test and...
Ch. 11.1 - In Exercises 520, conduct the hypothesis test and...Ch. 11.1 - In Exercises 520, conduct the hypothesis test and...Ch. 11.1 - In Exercises 520, conduct the hypothesis test and...Ch. 11.1 - In Exercises 520, conduct the hypothesis test and...Ch. 11.1 - In Exercises 520, conduct the hypothesis test and...Ch. 11.1 - In Exercises 520, conduct the hypothesis test and...Ch. 11.1 - In Exercises 520, conduct the hypothesis test and...Ch. 11.1 - In Exercises 520, conduct the hypothesis test and...Ch. 11.1 - In Exercises 520, conduct the hypothesis test and...Ch. 11.1 - In Exercises 520, conduct the hypothesis test and...Ch. 11.1 - Ben fords Law. According to Benfords law, a...Ch. 11.1 - Ben fords Law. According to Benfords law, a...Ch. 11.1 - Ben fords Law. According to Benfords law, a...Ch. 11.1 - Ben fords Law. According to Benfords law, a...Ch. 11.1 - Assumed mid-point x=fxn=39825180=221.25...Ch. 11.2 - Handedness and Cell Phone Use The accompanying...Ch. 11.2 - Ear Preference for Cell Phone Use 2. Hypotheses...Ch. 11.2 - Hypothesis Test The accompanying TI-83/84 Plus...Ch. 11.2 - Right-Tailed, Left-Tailed, Two-Tailed Is the...Ch. 11.2 - Prob. 5BSCCh. 11.2 - In Exercises 5-18, test the given claim. 6. Splint...Ch. 11.2 - In Exercises 5-18, test the given claim. 7....Ch. 11.2 - Prob. 8BSCCh. 11.2 - In Exercises 5-18, test the given claim. 9. Four...Ch. 11.2 - In Exercises 5-18, test the given claim. 10....Ch. 11.2 - In Exercises 5-18, test the given claim. 11....Ch. 11.2 - In Exercises 5-18, test the given claim. 12. Nurse...Ch. 11.2 - Soccer Strategy In soccer, serious fouls in the...Ch. 11.2 - In Exercises 5-18, lest the given claim. 14. Is...Ch. 11.2 - In Exercises 518, test the given claim. 15....Ch. 11.2 - In Exercises 5-18, test the given claim. 16....Ch. 11.2 - Prob. 17BSCCh. 11.2 - In Exercises 5-18, test the given claim. 18....Ch. 11.2 - In Exercises 5-18, lest the given claim. 19. Car...Ch. 11.2 - Is the Home Field Advantage Independent of the...Ch. 11.2 - Equivalent Tests A X2 test involving a 2 2 table...Ch. 11.2 - Using Yatess Correction for Continuity The...Ch. 11 - Exercises 1-5 refer to the sample data in the...Ch. 11 - Exercises 15 refer to the sample data in the...Ch. 11 - Exercises 15 refer to the sample data in the...Ch. 11 - Prob. 4CQQCh. 11 - Exercises 15 refer to the sample data in the...Ch. 11 - Questions 610 refer to the sample data in the...Ch. 11 - Questions 610 refer to the sample data in the...Ch. 11 - Questions 6-10 refer to the sample data in the...Ch. 11 - Find the number of degrees of freedom.Ch. 11 - Questions 6-10 refer to the sample data in the...Ch. 11 - Motor Vehicle Fatalities The table below lists...Ch. 11 - Tooth Fillings The table below shows results from...Ch. 11 - American Idol Contestants on the TV show American...Ch. 11 - Clinical Trial of Lipitor Lipitor is the trade...Ch. 11 - Weather-Related Deaths For a recent year, the...Ch. 11 - Weather-Related Deaths Review Exercise 5 involved...Ch. 11 - Chocolate and Happiness In a survey sponsored by...Ch. 11 - Chocolate and Happiness Use the results from part...Ch. 11 - Chocolate and Happiness Use the results from part...Ch. 11 - One Big Bill or Many Smaller Bills In a study of...Ch. 11 - 6. Probability Refer to the results from the 150...Ch. 11 - Car Repair Costs Listed below are repair costs (in...Ch. 11 - Forward Grip Reach and Ergonomics When designing...Ch. 11 - Use Statdisk, Minitab, Excel, StatCrunch, a...Ch. 11 - FROM DATA TO DECISION Critical Thinking: Was...
Knowledge Booster


Learn more about
Need a deep-dive on the concept behind this application? Look no further. Learn more about this topic, statistics and related others by exploring similar questions and additional content below.Similar questions
- Question 4 An article in Quality Progress (May 2011, pp. 42-48) describes the use of factorial experiments to improve a silver powder production process. This product is used in conductive pastes to manufacture a wide variety of products ranging from silicon wafers to elastic membrane switches. Powder density (g/cm²) and surface area (cm/g) are the two critical characteristics of this product. The experiments involved three factors: reaction temperature, ammonium percentage, stirring rate. Each of these factors had two levels, and the design was replicated twice. The design is shown in Table 3. A222222222222233 Stir Rate (RPM) Ammonium (%) Table 3: Silver Powder Experiment from Exercise 13.23 Temperature (°C) Density Surface Area 100 8 14.68 0.40 100 8 15.18 0.43 30 100 8 15.12 0.42 30 100 17.48 0.41 150 7.54 0.69 150 8 6.66 0.67 30 150 8 12.46 0.52 30 150 8 12.62 0.36 100 40 10.95 0.58 100 40 17.68 0.43 30 100 40 12.65 0.57 30 100 40 15.96 0.54 150 40 8.03 0.68 150 40 8.84 0.75 30 150…arrow_forward- + ++ Table 2: Crack Experiment for Exercise 2 A B C D Treatment Combination (1) Replicate I II 7.037 6.376 14.707 15.219 |++++ 1 བྱ॰༤༠སྦྱོ སྦྱོཋཏྟཱུ a b ab 11.635 12.089 17.273 17.815 с ас 10.403 10.151 4.368 4.098 bc abc 9.360 9.253 13.440 12.923 d 8.561 8.951 ad 16.867 17.052 bd 13.876 13.658 abd 19.824 19.639 cd 11.846 12.337 acd 6.125 5.904 bcd 11.190 10.935 abcd 15.653 15.053 Question 3 Continuation of Exercise 2. One of the variables in the experiment described in Exercise 2, heat treatment method (C), is a categorical variable. Assume that the remaining factors are continuous. (a) Write two regression models for predicting crack length, one for each level of the heat treatment method variable. What differences, if any, do you notice in these two equations? (b) Generate appropriate response surface contour plots for the two regression models in part (a). (c) What set of conditions would you recommend for the factors A, B, and D if you use heat treatment method C = +? (d) Repeat…arrow_forwardQuestion 2 A nickel-titanium alloy is used to make components for jet turbine aircraft engines. Cracking is a potentially serious problem in the final part because it can lead to nonrecoverable failure. A test is run at the parts producer to determine the effect of four factors on cracks. The four factors are: pouring temperature (A), titanium content (B), heat treatment method (C), amount of grain refiner used (D). Two replicates of a 24 design are run, and the length of crack (in mm x10-2) induced in a sample coupon subjected to a standard test is measured. The data are shown in Table 2. 1 (a) Estimate the factor effects. Which factor effects appear to be large? (b) Conduct an analysis of variance. Do any of the factors affect cracking? Use a = 0.05. (c) Write down a regression model that can be used to predict crack length as a function of the significant main effects and interactions you have identified in part (b). (d) Analyze the residuals from this experiment. (e) Is there an…arrow_forward
- A 24-1 design has been used to investigate the effect of four factors on the resistivity of a silicon wafer. The data from this experiment are shown in Table 4. Table 4: Resistivity Experiment for Exercise 5 Run A B с D Resistivity 1 23 2 3 4 5 6 7 8 9 10 11 12 I+I+I+I+Oooo 0 0 ||++TI++o000 33.2 4.6 31.2 9.6 40.6 162.4 39.4 158.6 63.4 62.6 58.7 0 0 60.9 3 (a) Estimate the factor effects. Plot the effect estimates on a normal probability scale. (b) Identify a tentative model for this process. Fit the model and test for curvature. (c) Plot the residuals from the model in part (b) versus the predicted resistivity. Is there any indication on this plot of model inadequacy? (d) Construct a normal probability plot of the residuals. Is there any reason to doubt the validity of the normality assumption?arrow_forwardStem1: 1,4 Stem 2: 2,4,8 Stem3: 2,4 Stem4: 0,1,6,8 Stem5: 0,1,2,3,9 Stem 6: 2,2 What’s the Min,Q1, Med,Q3,Max?arrow_forwardAre the t-statistics here greater than 1.96? What do you conclude? colgPA= 1.39+0.412 hsGPA (.33) (0.094) Find the P valuearrow_forward
- A poll before the elections showed that in a given sample 79% of people vote for candidate C. How many people should be interviewed so that the pollsters can be 99% sure that from 75% to 83% of the population will vote for candidate C? Round your answer to the whole number.arrow_forwardSuppose a random sample of 459 married couples found that 307 had two or more personality preferences in common. In another random sample of 471 married couples, it was found that only 31 had no preferences in common. Let p1 be the population proportion of all married couples who have two or more personality preferences in common. Let p2 be the population proportion of all married couples who have no personality preferences in common. Find a95% confidence interval for . Round your answer to three decimal places.arrow_forwardA history teacher interviewed a random sample of 80 students about their preferences in learning activities outside of school and whether they are considering watching a historical movie at the cinema. 69 answered that they would like to go to the cinema. Let p represent the proportion of students who want to watch a historical movie. Determine the maximal margin of error. Use α = 0.05. Round your answer to three decimal places. arrow_forward
- A random sample of medical files is used to estimate the proportion p of all people who have blood type B. If you have no preliminary estimate for p, how many medical files should you include in a random sample in order to be 99% sure that the point estimate will be within a distance of 0.07 from p? Round your answer to the next higher whole number.arrow_forwardA clinical study is designed to assess the average length of hospital stay of patients who underwent surgery. A preliminary study of a random sample of 70 surgery patients’ records showed that the standard deviation of the lengths of stay of all surgery patients is 7.5 days. How large should a sample to estimate the desired mean to within 1 day at 95% confidence? Round your answer to the whole number.arrow_forwardA clinical study is designed to assess the average length of hospital stay of patients who underwent surgery. A preliminary study of a random sample of 70 surgery patients’ records showed that the standard deviation of the lengths of stay of all surgery patients is 7.5 days. How large should a sample to estimate the desired mean to within 1 day at 95% confidence? Round your answer to the whole number.arrow_forward
arrow_back_ios
SEE MORE QUESTIONS
arrow_forward_ios
Recommended textbooks for you

Hypothesis Testing - Solving Problems With Proportions; Author: The Organic Chemistry Tutor;https://www.youtube.com/watch?v=76VruarGn2Q;License: Standard YouTube License, CC-BY
Hypothesis Testing and Confidence Intervals (FRM Part 1 – Book 2 – Chapter 5); Author: Analystprep;https://www.youtube.com/watch?v=vth3yZIUlGQ;License: Standard YouTube License, CC-BY