
Concept explainers
Videos
(a)
To identify the shape of each distribution.
(a)
Answer to Problem 21E
Both the brands are skewed right.
Explanation of Solution
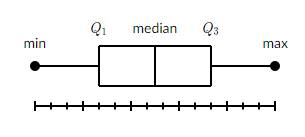
Given information: Box-and-whisker plot.
Calculation:
Both the brands are skewed right.
Fewer data plots are found to the right of the graph. The "tail" of the graph is pulled toward higher positive numbers, or to the right. The mean typically gets pulled toward the tail, and is greater than the median.
(b)
To find the range of upper
(b)
Answer to Problem 21E
Range of upper
Range of upper
Explanation of Solution
Given information: Box-and-whisker plot.
Formula Used:Range of the data=
Calculation:
As the range of the data:
- Brand A
Range of upper
So,
Range of upper
Hence,
Range of upper
- Brand B
Range of upper
So,
Range of upper
Hence,
Range of upper
(c)
To find the interquartile range of data.
(c)
Answer to Problem 21E
InterquartileRange of brand A=
InterquartileRange of brand B=
Explanation of Solution
Given information: Box-and-whisker plot.
Formula Used:InterquartileRange of the data=
Calculation:

As the range of the data:
- Brand A
InterquartileRange of brand A=
So,
InterquartileRange of brand A=
Hence,
InterquartileRange of brand A=
- Brand B
InterquartileRange of brand B=
So,
InterquartileRange of brand B=
Hence,
InterquartileRange of brand B=
(d)
To find the greater standard deviation.
(d)
Answer to Problem 21E
Brand A has greater standard deviation
Explanation of Solution
Given information: Box-and-whisker plot.
Formula Used:Standard deviation =
Calculation:
The standard deviation is approximately equal to the
Also,
The standard deviation is approximately equal to
Both estimates work best for normal distribution, i.e. distributions that are not skewed, and the first approximation works best if they are no outliers. They will later determine additional relations between the standard deviation for
Outliers are data points that fall below
- Range A:
Range of brand A=
Now,
Range of brand A=
So,
Standard deviation =
Hence,
Standard deviation of brand A=
- Range B:
Range of brand B =
Now,
Range of brand B =
So,
Standard deviation =
Hence,
Standard deviation of brand B =
(e)
To identify the brand with more battery life.
(e)
Answer to Problem 21E
Brand A
Explanation of Solution
Given information: Box-and-whisker plot.
Calculation:
Range of brand A=
and
Range of brand B =
Hence,
Brand A will be choose because it has greater range than brand B.
Chapter 11 Solutions
BIG IDEAS MATH Integrated Math 1: Student Edition 2016


- Required information A telephone cable is clamped at A to the pole AB. The tension in the left-hand portion of the cable is given to be T₁ = 815 lb. T₁ 15° A 25° T₂ I B Using trigonometry, determine the corresponding magnitude of R. The corresponding magnitude of R is lb.arrow_forwardTwo forces are applied as shown to a hook support. The magnitude of P is 38 N. 50 N 25° DC a Determine the corresponding magnitude of R. The magnitude of R is N.arrow_forwardNo chatgpt pls will upvote I need asap .arrow_forward
- Describe enlargement on map gridarrow_forwardLet y(t) represent your retirement account balance, in dollars, after t years. Each year the account earns 7% interest, and you deposit 8% of your annual income. Your current annual income is $34000, but it is growing at a continuous rate of 2% per year. Write the differential equation modeling this situation. dy dtarrow_forwardDetermine Whether series converge or diverge if it converge what is the limit. $\{ \frac {(-1)^{n-2}n^{2}}{4+n^{3}}\} _{n=0}^{\infty }$arrow_forward
- Let y(t) represent your retirement account balance, in dollars, after t years. Each year the account earns 7% interest, and you deposit 8% of your annual income. Your current annual income is $34000, but it is growing at a continuous rate of 2% per year. Write the differential equation modeling this situation. dy dtarrow_forward8:37 ▬▬▬▬▬▬▬▬▬ Ο Graph of f The figure shows the graph of a periodic function f in the xy-plane. What is the frequency of f? 0.5 B 2 C 3 D 8 3 of 6 ^ Oli Back Next apclassroom.collegeboard.orgarrow_forward2. The growth of bacteria in food products makes it necessary to time-date some products (such as milk) so that they will be sold and consumed before the bacteria count is too high. Suppose for a certain product that the number of bacteria present is given by f(t)=5000.1 Under certain storage conditions, where t is time in days after packing of the product and the value of f(t) is in millions. The solution to word problems should always be given in a complete sentence, with appropriate units, in the context of the problem. (a) If the product cannot be safely eaten after the bacteria count reaches 3000 million, how long will this take? (b) If t=0 corresponds to January 1, what date should be placed on the product?arrow_forward
- 2.6 Applications: Growth and Decay; Mathematics of Finances 1. A couple wants to have $50,000 in 5 years for a down payment on a new house. (a) How much should they deposit today, at 6.2% compounded quarterly, to have the required amount in 5 years? (b) How much interest will be earned? (c) If they can deposit only $30,000 now, how much more will they need to complete the $50,000 after 5 years? Note, this is not 50,000-P3.arrow_forwardPlease help.arrow_forwardPlease help on botharrow_forward
 Discrete Mathematics and Its Applications ( 8th I...MathISBN:9781259676512Author:Kenneth H RosenPublisher:McGraw-Hill Education
 Mathematics for Elementary Teachers with Activiti...MathISBN:9780134392790Author:Beckmann, SybillaPublisher:PEARSON
 Thinking Mathematically (7th Edition)MathISBN:9780134683713Author:Robert F. BlitzerPublisher:PEARSON
 Discrete Mathematics With ApplicationsMathISBN:9781337694193Author:EPP, Susanna S.Publisher:Cengage Learning,
 Pathways To Math Literacy (looseleaf)MathISBN:9781259985607Author:David Sobecki Professor, Brian A. MercerPublisher:McGraw-Hill Education