
Videos
(a)
To find the range of data.
(a)
Answer to Problem 15E
Range=
Explanation of Solution
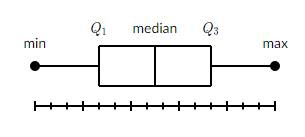
Given information: Box-and-whisker plot.
Formula Used:Range of the data=
Calculation:
As the range of the data:
So,
Range=
Hence,
Range=
(b)
To describe the distribution of data.
(b)
Answer to Problem 15E
Positively Skewed
Explanation of Solution
Given information: Box-and-whisker plot.
Calculation:

The distribution is positively skewed as the mean typically gets pulled toward the tail, and is greater than the median.
(c)
To find the interquartile range of data.
(c)
Answer to Problem 15E
Interquartile Range=
Explanation of Solution
Given information: Box-and-whisker plot.
Formula Used:Interquartile range of the data=
Calculation:

As the Interquartile range of the data =
So,
Interquartile Range=
Hence,
Interquartile Range=
(D)
To describe the data more spread out.
(D)
Answer to Problem 15E
Yes
Explanation of Solution
Given information: Box-and-whisker plot.
Calculation:

Yes, the data is more spread out.
Because range of the data is much greater than interquartile range.
Chapter 11 Solutions
BIG IDEAS MATH Integrated Math 1: Student Edition 2016


- Reconsider the patient satisfaction data in Table 1. Fit a multiple regression model using both patient age and severity as the regressors. (a) Test for significance of regression. (b) Test for the individual contribution of the two regressors. Are both regressor variables needed in the model? (c) Has adding severity to the model improved the quality of the model fit? Explain your answer.arrow_forwardThe output voltage of a power supply is assumed to be normally distributed. Sixteen observations taken at random on voltage are as follows: 10.35, 9.30, 10.00, 9.96, 11.65, 12.00, 11.25, 9.58, 11.54, 9.95, 10.28, 8.37, 10.44, 9.25, 9.38, and 10.85. (a) Test the hypothesis that the mean voltage equals 12 V against a two-sided alternative using a = 0.05. (b) Construct a 95% two-sided confidence interval on μ. (c) Test the hypothesis that σ² = 11 using α = 0.05. (d) Construct a 95% two-sided confidence interval on σ. (e) Construct a 95% upper confidence interval on σ. (f) Does the assumption of normality seem reasonable for the output voltage?arrow_forwardAnalyze the residuals from the regression model on the patient satisfaction data from Exercise 3. Comment on the adequacy of the regression model.arrow_forward
- 3 y 7 Find the length of the curve x= + on 3 ≤ y ≤5. 21 4yarrow_forwardConsider the hypotheses: Hop=po H₁ppo where 2 is known. Derive a general expression for determining the sample size for detecting a true mean of 1μo with probability 1-ẞ if the type I error is a.arrow_forwardSuppose we wish to test the hypotheses: Họ : | = 15 H₁: 15 where we know that o² = 9.0. If the true mean is really 20, what sample size must be used to ensure that the probability of type II error is no greater than 0.10? Assume that a = 0.05.arrow_forward
- Moment of a Force 2.14 Ma= Does Box Tip Over?=- 2.15 (change beam weight to 900 N)) X= 2.17 P= Varignon's Theorem 2.19 (change story height to 5m) Ma= 2.21 MA=. MB=_ 2.23 (change maximum tension to 2500 lbs) W= Couple and Moment of a Couple 2.24 MA=. MB=_ 2.26 (change force to 110 KN) F= M= Answer all parts, please.arrow_forwardMatch each statement to the set of shapes that best describes them. 1. Similar triangles by SSS 2. Similar triangles by SAS 3. Similar triangles by AA 4. The triangles are not similar > U E 35° 89° S F 89° J 35° 94° G 52° 90° E K 52° Iarrow_forwardTable 1 contains the data from a patient satisfaction survey for a group of 25 randomly selected patients at a hospital. In addition to satisfaction, data were collected on patient age and an index that measured the severity of illness. (a) Fit a linear regression model relating satisfaction to patient age. (b) Test for significance of regression. (c) What portion of the total variability is accounted for by the regressor variable age? Table 1: Patient Satisfaction Data Severity Observation Age (21) (x2) Satisfaction (y) 1 55 50 2 46 24 3 30 46 4 35 48 5 59 58 6 61 60 7 74 65 8 38 42 9 27 42 10 51 50 11 53 38 12 41 30 13 37 31 88 14 24 34 15 42 30 16 50 48 17 58 61 18 60 71 19 62 62 20 68 38 21 70 41 22 79 66 23 63 31 24 39 42 25 49 40 BE225222222222222222 68 77 96 80 43 44 26 88 75 57 56 88 102 88 70 43 46 56 59 26 83 75arrow_forward
- Match each transformation series with the diagram that applies to it. 1. (x, y) (x-10, y + 7) scale factor: 2 2. (x, y)(x-8, y+6) scale factor: 4 3. (x, y)(x+1, y - 5) scale factor: 5 D' 104º 6 2 -10 8 -6 F2 4 5 D 2 E -4 -6 100 E 8 10 Farrow_forwardthe answer is Dcould you explain how using the curland also please disprove each option that is wrongarrow_forwardWhich sets of figures below are similar? Select all that apply. 48 yd 48 yd G 48 yd 26 mm 40 m 23 km 25 m 22 mm 37 mm 25 mi 42 yd 48 yd 48 yd 48 yd U 42 yd 25 mm M T 40 mi 20 mm 25 mm 30 mi 48 m K 37 mm 20 mm 48 m S 30 mi 73 km 29 km 29 kmarrow_forward
 Discrete Mathematics and Its Applications ( 8th I...MathISBN:9781259676512Author:Kenneth H RosenPublisher:McGraw-Hill Education
 Mathematics for Elementary Teachers with Activiti...MathISBN:9780134392790Author:Beckmann, SybillaPublisher:PEARSON
 Thinking Mathematically (7th Edition)MathISBN:9780134683713Author:Robert F. BlitzerPublisher:PEARSON
 Discrete Mathematics With ApplicationsMathISBN:9781337694193Author:EPP, Susanna S.Publisher:Cengage Learning,
 Pathways To Math Literacy (looseleaf)MathISBN:9781259985607Author:David Sobecki Professor, Brian A. MercerPublisher:McGraw-Hill Education