Concept explainers
To calculate:
The histogram for the following data and tell that it is
| Tickets sold | Frequency |
Answer to Problem 27E
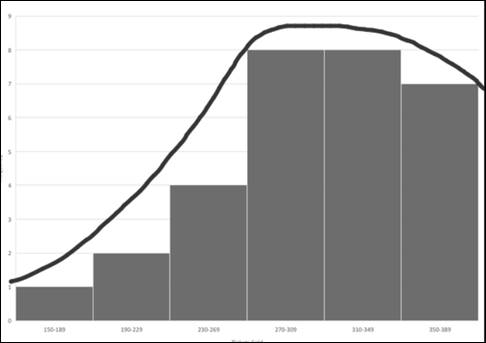
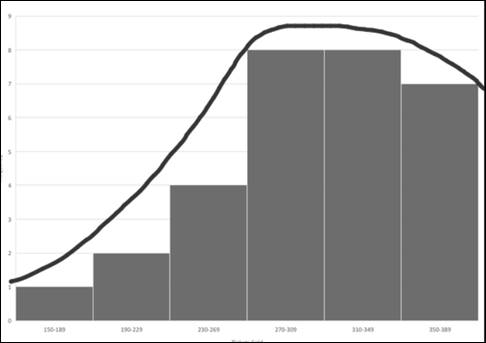
The histogram for the given data is:

The drawn histogram of given data is not a normal distribution.
Explanation of Solution
Given information:
| Tickets sold | Frequency |
Calculation:
Firstly need to draw a histogram of given data as and then check it for the normal distribution:

From the histogram diagram:
The shape of the curve is neither bell shaped nor symmetrical on both sides. In the normal distribution curve there is an equal distribution of data on each side of mean or median or data.
But in the drawn curve, there is no equal distribution on both sides of mean that’s why the histogram of given data is not a normal distribution.
Chapter 11 Solutions
Big Ideas Math A Bridge To Success Algebra 2: Student Edition 2015
- 1. For the following subsets of R3, explain whether or not they are a subspace of R³. (a) (b) 1.1 0.65 U = span -3.4 0.23 0.4 -0.44 0 (})} a V {(2) | ER (c) Z= the points in the z-axisarrow_forwardSolve the following equation forx. leave answer in Simplified radical form. 5x²-4x-3=6arrow_forwardMATCHING LIST Question 6 Listen Use the given equations and their discriminants to match them to the type and number of solutions. 00 ed two irrational solutions a. x²+10x-2=-24 two rational solutions b. 8x²+11x-3=7 one rational solution c. 3x²+2x+7=2 two non-real solutions d. x²+12x+45 = 9 DELL FLOWER CHILD 10/20 All Changes S $681 22991arrow_forward
- 88 MULTIPLE CHOICE Question 7 Listen The following irrational expression is given in unsimplified form with four op- tions in simplified form. Select the correct simplified form. Select only one option. A 2±3√√2 B 4±√3 2±√ √3 D 1±√√3 DELL FLOWER CHILD 11/200 4 ± √48 4 ✓ All Changes Saved 165arrow_forwardUse the graph of y = f(x) to answer the following. 3- 2 -4 -2 -1 1 2 3 4 -1 2 m -3- + (d) Find all x for which f(x) = -2. If there is more than one value, separate them with commas or write your answer in interval notation, if necessary. Select "None", if applicable. Value(s) of x for which f(x)=-2: | (0,0) (0,0) (0,0) (0,0) 0,0... -00 None (h) Determine the range of f. The range is (0,0) Garrow_forwardWhat is g(f(4))arrow_forward
- 10) Multiply (8m + 3)² A) 8m²+11m+6 B) m² + 48m+9 C) 64m²+48m+9 D) 16m²+11m+6arrow_forwardLet R be field and X= R³/s Vector space over R M=(a,b,c)labic, e Rra+b= 3- <3 Show that Ms and why with proof. 1) is convexset and affine set of botost ii) is blanced set and symmetirs set of x iii) is hy per space and hyper plane ofx or hot iii) find f:MR st kerf = M 18/103 and finnd fiM→R/{0} st M= {xEX, f(t) = x, texiαER? jiii) show that Mis Maxsubspace or not and Mis a max. affine set or not.arrow_forwardFind The partial fraction decomposition for each The following 2× B) (x+3) a 3 6 X-3x+2x-6arrow_forward
- 1) Find the partial feraction decomposition for each of 5- X 2 2x+x-1 The following: 3 B) 3 X + 3xarrow_forwardT={(−7,1),(1,−1),(6,−8),(2,8)} Find the domain and range of the inverse. Express your answer as a set of numbers.arrow_forwardT={(−7,1),(1,−1),(6,−8),(2,8)}. Find the inverse. Express your answer as a set of ordered pairs.arrow_forward
 Algebra and Trigonometry (6th Edition)AlgebraISBN:9780134463216Author:Robert F. BlitzerPublisher:PEARSON
 Contemporary Abstract AlgebraAlgebraISBN:9781305657960Author:Joseph GallianPublisher:Cengage Learning
 Linear Algebra: A Modern IntroductionAlgebraISBN:9781285463247Author:David PoolePublisher:Cengage Learning
 Algebra And Trigonometry (11th Edition)AlgebraISBN:9780135163078Author:Michael SullivanPublisher:PEARSON
 Introduction to Linear Algebra, Fifth EditionAlgebraISBN:9780980232776Author:Gilbert StrangPublisher:Wellesley-Cambridge Press
 College Algebra (Collegiate Math)AlgebraISBN:9780077836344Author:Julie Miller, Donna GerkenPublisher:McGraw-Hill Education


