
Concept explainers
Videos
A company produces to a seasonal demand, with the
- a. What is the cost of carrying inventory for the month of January for the level strategy?
- b. What is the total cost of the level strategy including regular time, inventory carrying cost and changes in production level?
- c. What is the total cost of the chase strategy?
a)
To determine: The inventory carrying cost for the month of January for the level strategy.
Introduction:
The aggregate plan is the output of sales and operations planning. The major concern of aggregate planning is the production time and quantity for the intermediate future. There are three kinds of aggregate planning; they are level strategy, chase strategy, and mixed strategy.
Explanation of Solution
Given information:
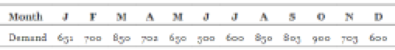
The present labor force can produce 500 units per month, and the demand with the forecast for the next 12 months is given below:
| Month | Demand |
| J | 651 |
| F | 700 |
| M | 850 |
| A | 702 |
| M | 650 |
| J | 500 |
| J | 600 |
| A | 850 |
| S | 803 |
| O | 900 |
| N | 703 |
| D | 600 |
Each employee can produce 20 units per month and is paid $2,000 per month. Inventory carrying cost is given as $50 per unit per year. Changes in the production level is $100 per unit during line changeover costs, hiring, and layoffs. Initial inventory is given as 200 units.
Determine the inventory for 12 months:
| Month | Demand | Production | Inventory |
| J | 651 | 709.08 | 258.08 |
| F | 700 | 709.08 | 267.17 |
| M | 850 | 709.08 | 126.25 |
| A | 702 | 709.08 | 133.33 |
| M | 650 | 709.08 | 192.42 |
| J | 500 | 709.08 | 401.50 |
| J | 600 | 709.08 | 510.58 |
| A | 850 | 709.08 | 369.67 |
| S | 803 | 709.08 | 275.75 |
| O | 900 | 709.08 | 84.83 |
| N | 703 | 709.08 | 90.92 |
| D | 600 | 709.08 | 200.00 |
| Total | 8509 | 8509.00 | 2910.50 |
Computation of inventory for 12 months:
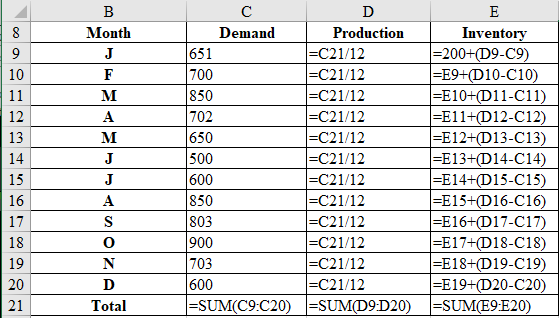
Determine the cost of carrying inventory for the month of January for the level strategy:
It is calculated by multiplying the inventory for the month of January (refer table), and the value is attained by dividing inventory carrying cost and number of months.
Hence, the inventory carrying cost is $1,075.33.
b)
To determine: The total cost of level strategy.
Introduction:
The aggregate plan is the output of sales and operations planning. The major concern of aggregate planning is the production time and quantity for the intermediate future. There are three kinds of aggregate planning; they are level strategy, chase strategy, and mixed strategy.
Explanation of Solution
Given information:
The current labor force can produce 500 units per month, and the demand with the forecast for the next 12 months is given below:
| Month | Demand |
| J | 651 |
| F | 700 |
| M | 850 |
| A | 702 |
| M | 650 |
| J | 500 |
| J | 600 |
| A | 850 |
| S | 803 |
| O | 900 |
| N | 703 |
| D | 600 |
Each employee can produce 20 units per month and is paid $2,000 per month. Inventory carrying cost is given as $50 per unit per year. Deviations in the production level is $100 per unit during line changeover costs, hiring, and layoffs. Initial inventory is given as 200 units.
Determine the regular time cost:
It is calculated by multiplying production units, number of months, and changes in the production level cost.
Hence, the regular time cost is $850,896.
Determine the inventory carrying cost:
It is computed by multiplying the sum of inventory (refer table), and the value is attained by dividing inventory carrying cost and number of months.
Determine the change in production level:
It is calculated by multiplying the changes in the production line and the difference between regular production per month and the calculated production.
Determine the total cost of level strategy:
It is calculated by adding regular time cost, inventory carrying cost, and change in production level cost.
Hence, the total cost of level strategy is $883,923.08.
c)
To determine: The total cost of chase strategy.
Introduction:
The aggregate plan is the output of sales and operations planning. The major concern of aggregate planning is the production time and quantity for the intermediate future. There are three kinds of aggregate planning; they are level strategy, chase strategy, and mixed strategy.
Explanation of Solution
Given information:
The current labor force can produce 500 units per month, and the demand with the forecast for the next 12 months is given below:
| Month | Demand |
| J | 651 |
| F | 700 |
| M | 850 |
| A | 702 |
| M | 650 |
| J | 500 |
| J | 600 |
| A | 850 |
| S | 803 |
| O | 900 |
| N | 703 |
| D | 600 |
Each employee can produce 20 units per month and is paid $2,000 per month. Inventory carrying cost is given as $50 per unit per year. Changes in the production level is $100 per unit during line changeover costs, hiring, and layoffs. Initial inventory is given as 200 units.
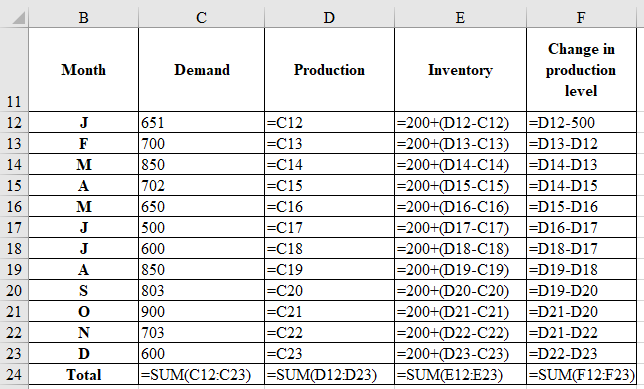
Determine the inventory for 12 months:
| Month | Demand | Production | Inventory | Change in production level |
| J | 651 | 651 | 200 | 151 |
| F | 700 | 700 | 200 | 49 |
| M | 850 | 850 | 200 | 150 |
| A | 702 | 702 | 200 | 148 |
| M | 650 | 650 | 200 | 52 |
| J | 500 | 500 | 200 | 150 |
| J | 600 | 600 | 200 | 100 |
| A | 850 | 850 | 200 | 250 |
| S | 803 | 803 | 200 | 47 |
| O | 900 | 900 | 200 | 97 |
| N | 703 | 703 | 200 | 197 |
| D | 600 | 600 | 200 | 103 |
| Total | 8509 | 8509 | 2400 | 1494 |
Computation of inventory for 12 months:
Determine the regular time cost:
It is computed by multiplying production units, number of months, and changes in the production level cost.
Hence, the regular time cost is $850,900.
Determine the inventory carrying cost:
It is calculated by multiplying the sum of inventory (refer table), and the value is attained by dividing inventory carrying cost and number of months.
Determine the change in production level:
It is calculated by multiplying the sum of changes in the production level and cost of change in production line.
Determine the total cost of chase strategy:
It is calculated by adding regular time cost, inventory carrying cost, and change in production level cost.
Hence, the total cost of chase strategy is $1,010,300.
Want to see more full solutions like this?
Chapter 11 Solutions
OPERATIONS MANAGEMENT IN THE SUPPLY CHAIN: DECISIONS & CASES (Mcgraw-hill Series Operations and Decision Sciences)


- What is the first thing a leader should do when moving through a cultural change? conduct an assessment comparing the practices to other high-performing organizations learn about the current organizational culture continue to monitor key metrics define expectationsarrow_forwardThe third change leadership strategy, Collaborate on Implementation, is designed to address what type of concerns? impact concerns personal concerns refinement concerns collaboration concernsarrow_forwardIf team members are concerned with specifics such as their tasks, contingency plans, resources, and timeline, what concerns do they have? implementation concerns impact concerns refinement concerns personal concernsarrow_forward
- At the developing stage of organizational development, which leadership style is most appropriate? supporting coaching delegating directingarrow_forwardDuring the start-up phase of organizations, which leadership style is appropriate? supporting coaching directing delegatingarrow_forwardRegarding relationships and results, what is typically seen in start-up orgnanizations? low results/high relationships low results/low relationships high results/high relationships high results/ low relationshipsarrow_forward
- What issues lie within Employee and Labor relations with hours worked and how to solve the issues effectively.arrow_forwardName the key stakeholders in the case. Consider the stakeholder map in the lecture material. Which stakeholders would be the most important under your default lens?arrow_forwardresearch Walmart as chosen organization through primary and secondary sources, investigate the organization's mission and vision statement and code of ethics. What is a potential social cause that can be recommend to Walmart that is different than any current social cause Walmart pursues. Research a variety of sources, including the Walmarts website, social media sites, company blogs, industry and trade sources, and other sources, provide a summary of the organization, including Walmarts products or services, customer or client base, areas of operation or distribution, history, main competition, and the organization's current situation. Analyze the mission, vision, and values of Walmart. Evaluate the ethical principles and policy under which Walmart works.arrow_forward
- Read Himachal Fertilizer Corporation (B) and critique the decision he actually made after reading Part B. Was your recommendation similar to what Neil did...how was it the same or how did it differ? Explain why with details from course materials and the case.arrow_forwardName the key stakeholders in the Himachal Fertilizer Corporation Part A case. Consider the stakeholder map in the image below. Which stakeholders would be the most important under your default lens?arrow_forwardThis crosstab shows product sub-category sales within categories, broken out by sales quarter. The quarterly values for each sub-category increase within each category, with the largest value at the bottom. Using Running Total as the calculation type, which scope and direction option gives this result?arrow_forward
 Practical Management ScienceOperations ManagementISBN:9781337406659Author:WINSTON, Wayne L.Publisher:Cengage,
 MarketingMarketingISBN:9780357033791Author:Pride, William MPublisher:South Western Educational Publishing
 Purchasing and Supply Chain ManagementOperations ManagementISBN:9781285869681Author:Robert M. Monczka, Robert B. Handfield, Larry C. Giunipero, James L. PattersonPublisher:Cengage Learning