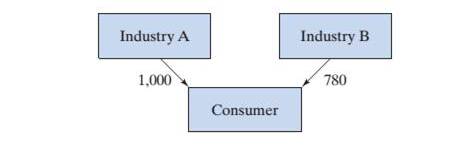
The Russian-born U.S. economist and Nobel laureate Wassily Leontief(1906—1999) was interested in the following question: What output should each of the industries in an economy produce to satisfy the total demandfor all products? Here, we consider a very simple example of input—output analysis, an economy with only twoindustries, A and B. Assume that the consumer demandfor their products is, respectively, 1 ,000 and 780, in millions of dollars per year.
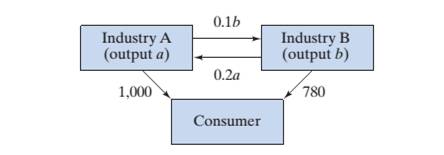
What outputs a andb (in millions of dollars peryear) should the two industries generate to satisfy thedemand? You may be tempted to say 1,000 and 780,respectively, but things are not quite as simple as that.We have to take into account the interindustry demandas well. Let us say that industry A produces electricity.Of course, producing almost any product will requireelectric power. Suppose that industry B needs 10 worthof electricity for each $1 of output B produces and that industry A needs 20 ¢ worth of B’s products for each $1of output A produces. Find the outputs a andb neededto satisfy both consumer and interindustry demand.
Want to see the full answer?
Check out a sample textbook solutionChapter 1 Solutions
Linear Algebra with Applications (2-Download)
- This exercise requires the use of technology. Four sectors of the U.S. economy are (1) livestock and livestock products, (2) other agricultural products, (3) forestry and fishery products, and (4) agricultural, forestry, and fishery services. Suppose that in 1977 the input-output table involving these four sectors was as follows (all figures are in millions of dollars). Determine how these four sectors would react to an increase in demand for livestock (Sector 1) of $1,500 million, how they would react to an increase in demand for other agricultural products (Sector 2) of $1,500 million, and so on. (Round your answers to two decimal places. Let the columns of the matrix be given in millions of dollars.) To 1 2 3 4 From 1 11,937 9 109 855 2 26,649 4,285 4,744 439 61 4 5,423 10,952 3,002 216 Total Output 97,795 120,594 14,642 47,473arrow_forwardQ. Table provided gives data on gross domestic product (GDP) for the United States for the years 1959–2005. a. Plot the GDP data in current and constant (i.e., 2000) dollars against time. b. Letting Y denote GDP and X time (measured chronologically starting with 1 for 1959, 2 for 1960, through 47 for 2005), see if the following model fits the GDP data: Yt = β1 + β2 Xt + ut Estimate this model for both current and constant-dollar GDP. c. How would you interpret β2? d. If there is a difference between β2 estimated for current-dollar GDP and that estimated for constant-dollar GDP, what explains the difference? e. From your results what can you say about the nature of inflation in the United States over the sample period?arrow_forwardDemand for stereo headphones and MP3 players for joggers has caused Nina Industries to grow almost 50 percent over the past year. The number of joggers continues to expand, so Nina expects demand for headsets to also expand, because, as yet, no safety laws have been passed to prevent joggers from wearing them. Demand for the players for this year was as follows: MONTH DEMAND (UNITS) January 4,200 February 4,300 March 4,000 April 4,400 May 5,000 June 4,700 July 5,300 August 4,900 September 5,400 October 5,700 November 6,300 December 6,000 Using linear regression analysis, what would you estimate demand to be for each month next year? Using a spreadsheet, follow the general format in Exhibit 3.7. Note: Do not round intermediate calculations. Round your answers to 2 decimal places. To be reasonably confident of meeting demand, Nina decides to use three standard errors of estimate for safety. How many additional units should be held to meet this level…arrow_forward
- 2. From Wikipedia, the number of people on Earth in the years 1970, 1980, and 1990 was 3710 million, 4450 million, and 5280 million, respectively. Assuming the world population grows logistically, determine (a) the maximum number of people Earth can sustain, and (b) the year in which the population is expected to grow the fastest.arrow_forwardConsider the following scenario and select the best answer: A company is trying to determine how to allocate its $145.000 advertising budget for a new product. The company is considering newspaper ads and television commercials as its primary means for advertising. The following table summarizes the costs of advertising in these different media and the number of new customers reached by increasing amounts of advertising. Media & No. of Ads No. of New Customers Cost per Ad Reached Newspaper: 1-10 900 $1,000 Newspaper: 11-20 700 $900 Newspaper: 21-30 400 $800 Television: 1-5 10,000 $12,000 Television: 6–10 7,500 $10,000 Television: 11-15 5.000 $8,000 For instance, each of the first 10 ads the company places in newspapers will cost $1,000 and is expected to reach 900 new customers. Each of the next 10 newspaper ads will cost $900 and is expected to reach 700 new customers. Note that the number of new customers reached by increasing amounts of advertising decreases as the advertising…arrow_forwardAn entrepreneur who owns and operates two businesses (A and B) would like to analyze their profitability. They would like your help in the analysis. They give you the annual net profit (in thousands of $) for each business from 2008-2020. Table 1: Annual Net Profits for Businesses A and B Business Year Profit Business Year Profit 2008 -50 2008 -10 2009 57 2009 30 2010 71 2010 27 2011 64 2011 22 2012 60 2012 21 2013 50 2013 20 A 2014 41 2014 24 2015 59 2015 24 2016 71 2016 32 2017 71 2017 36 2018 74 2018 37 019 81 20 40 2020 97 2020 49 a. Suppose you want to graph the distribution of profits. Explain why using only one stem- plot might not be optimal for the analysis. b. Describe the correct stemplot to use. Generate this stemplot. Explain your steps. What can you say about the distribution from this stemplot? c. When are stemplots useful? And why is that? d. Suppose that instead of having 26 observations you have 200 observations. What graph should you generate? e. What other type of…arrow_forward
- A farmer has recently acquired a 110 hectares piece of land. He has decided to grow Wheat and barley on that land. Due to the quality of the sun and the region's excellent climate, the entire production of Wheat and Barley can be sold. He wants to know how to plant each variety in the 110 hectares, given the costs, net profits and labor requirements according to the data shown below: Variety Cost (Price/Hec) Net Profit (Price/Hec) Man-days/Hec Wheat 100 50 10 Barley 200 120 30 The farmer has a budget of US$10,000 and an availability of 1,200 man-days during the planning horizon. In addition, the farmer would like to get a profit of at least $3000. Generate the mathematical model for the optimal usage of land area to produce wheat and barley. Using graphical method to optimize land usage, how many hectares are to be used for wheat and barley.arrow_forward• Part 1 Rework problem 8 in section 1 of Chapter 7 of your textbook, about the office furniture manufacturer, using the following data. Assume that each filing cabinets requires 55 pounds of steel and 3.5 hours of labor, and that each desk requires 70 pounds of steel and 2.5 hours of labor. Assume also that the manufacturer has available 144 tons of steel and 1400 hours of labor. Assume also that the profit on each desk is $40.00 and the profit on each filing cabinet is $33.00. How many filing cabinets and desks should the manufacturer produce in order maximize its profit? When you formulate a linear programming problem to solve this problem, how many variables, how many constraints (both implicit and explicit), and how many objective functions should you have? Number of variables: 2 Number of constraints: 4 Number of objective functions: 1 • Part 2 • Part 3 Formulate the linear programming problem for this situation. (Enter either the word Maximize or the word Minimize in the first…arrow_forwardG.97.arrow_forward
- Accounting procedures allow a business to evaluate its inventory costs based on two methods: LIFO (last in first out) or FIFO (first in first out). A manufacturer evaluated its finished goods inventory (in $000s) for five products with the LIFO and FIFO methods. To analyze the difference, they computed FIFO − LIFO for each product. Based on the following results, does the LIFO method result in a lower cost of inventory than the FIFO method? Product FIFO (F) LIFO (L) 1 225 221 2 119 100 3 100 113 4 212 200 5 248 245 What is the decision at the 5% level of significance? A) Fail to reject the null hypothesis and conclude LIFO is more effective.B) Reject the null hypothesis and conclude LIFO is more effective.C) Reject the alternate hypothesis and conclude LIFO is more effective.D) Fail to reject the null hypothesis.arrow_forwardThe sales manager of a large automotive parts distributor wants to estimate the total annual sales for each of the company’s regions. Three factors appear to be related to regional sales: the number of retail outlets in the region, the total personal income of the region, and the number of cars registered in the region. The following table shows the data for 10 regions that were gathered for last year sales. The excel data file for this problem is:final exam question 6B spring 2021.xlsx Region Annual sales ($ million) Number of retail outlets Number of automobiles registered (million) Personal income ($ billion) 1 37.702 1,739 9.27 85.4 2 24.196 1,221 5.86 60.7 3 32.055 1,846 8.81 68.1 4 3.611 120 4.81 20.1 5 17.625 1,096 10.31 33.8 6 45.919 2,290 11.62 95.1 7 29.600 1,687 8.96 69.3 8 8.114 241 6.28 16.5 9 20.116 649 7.77 34.9 10 12.994 1,427 10.92…arrow_forwardA shoe company forecasts the following demands during the next six months: month 1—200; month 2—260; month 3—240; month 4—340; month 5—190; month 6—150. It costs $7 to produce a pair of shoes with regular-time labor (RT) and $11 with overtime labor (OT). During each month, regular production is limited to 200 pairs of shoes, and overtime production is limited to 100 pairs. It costs $1 per month to hold a pair of shoes in inventory. a) Formulate a balanced transportation problem by stating the rules. b) Minimize the total cost of meeting the next six months of demand on time by using different methods available and compare the results.arrow_forward
- Linear Algebra: A Modern IntroductionAlgebraISBN:9781285463247Author:David PoolePublisher:Cengage Learning