
Videos
A bridge is to be constructed now as part of a new road. Engineers have determined that traffic density on the new road will justify a two-lane road and a bridge at the present time. Because of uncertainty regarding future use of the road, the time at which an extra two lanes will be required is currently being studied.
The two-lane bridge will cost $200,000 and the four- lane bridge, if built initially, will cost $350,000. The future cost of widening a two-lane bridge to four lanes will be an extra $200,000 plus $25,000 for every year that widening is delayed. The MARR used by the highway department is 12% per year. The following estimates have been made of the times at which the four-lane bridge will be required:
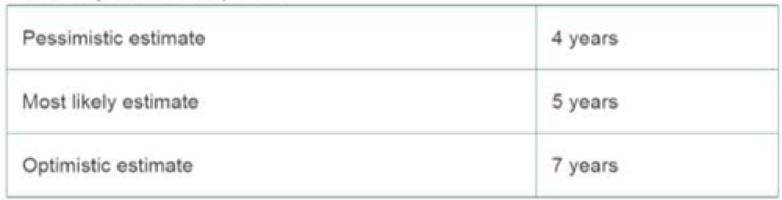
In view of these estimates, what would you recommend? What difficulty, if any, do you have in interpreting your results? List some advantages and disadvantages of this method of preparing estimates.
Want to see the full answer?
Check out a sample textbook solution
Chapter 11 Solutions
Engineering Economy, Student Value Edition (17th Edition)


- Not use ai please letarrow_forwardConsider the market for sweaters in a Hamilton neighbourhood shown in the figure to the right. The consumer surplus generated by consuming the 29th sweater is OA. $67.90. OB. $58.20. ○ C. $77.60. OD. $38.80. ○ E. $19.50. Price ($) 97 68.0 48.5 29.0 29.0 Sweater Market 48.5 Quantity (Sweaters per week)arrow_forwardNot use ai pleasearrow_forward
- In the following table, complete the third column by determining the quantity sold in each country at a price of $18 per toy train. Next, complete the fourth column by calculating the total profit and the profit from each country under a single price. Price Single Price Quantity Sold Price Discrimination Country (Dollars per toy train) (Millions of toy trains) Profit (Millions of dollars) Price (Dollars per toy train) Quantity Sold (Millions of toy trains) Profit (Millions of dollars) France 18 Russia 18 Total N/A N/A N/A N/A Suppose that as a profit-maximizing firm, Le Jouet decides to price discriminate by charging a different price in each market, while its marginal cost of production remains $8 per toy. Complete the last three columns in the previous table by determining the profit-maximizing price, the quantity sold at that price, the profit in each country, and total profit if Le Jouet price discriminates. Le Jouet charges a lower price in the market with a relatively elastic…arrow_forwardNot use ai pleasearrow_forwardNot dhdjdjdjduudnxnxjfjfi feverarrow_forward
- Discuss the different types of resources (natural, human, capital) and how they are allocated in an economy. Identify which resources are scarce and which are abundant, and explain the implications of this scarcity or abundance.arrow_forwardNot use ai pleasearrow_forwardNot use ai please letarrow_forward
- Location should be in GWAGWALADA Abuja Nigeria Use the Internet to do itarrow_forwardUsing data from 1988 for houses sold in Andover, Massachusetts, from Kiel and McClain (1995), the following equation relates housing price (price) to the distance from a recently built garbage incinerator (dist): = log(price) 9.40 + 0.312 log(dist) n = 135, R2 = 0.162. Interpretation of the slope coefficient? ► How would our interpretation of the slope coefficient change if distance were measured in metres instead of kilometres?arrow_forwardIf GDP goes up by 1% and the investment component of GDPgoes up by more than 1%, how is the investment share ofGDP changing in absolute terms?▶ In economics, what else is expressed as relative percentagechanges?arrow_forward
 Managerial Economics: Applications, Strategies an...EconomicsISBN:9781305506381Author:James R. McGuigan, R. Charles Moyer, Frederick H.deB. HarrisPublisher:Cengage Learning
 Managerial Economics: A Problem Solving ApproachEconomicsISBN:9781337106665Author:Luke M. Froeb, Brian T. McCann, Michael R. Ward, Mike ShorPublisher:Cengage Learning

 Exploring EconomicsEconomicsISBN:9781544336329Author:Robert L. SextonPublisher:SAGE Publications, Inc