
Horizons: Exploring the Universe (MindTap Course List)
14th Edition
ISBN: 9781305960961
Author: Michael A. Seeds, Dana Backman
Publisher: Cengage Learning
expand_more
expand_more
format_list_bulleted
Concept explainers
Question
Chapter 11, Problem 1LTL
To determine
To discuss:
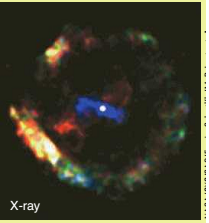
The appearance of the system a million years from now based on the given x-ray image which shows the supernova remnant and central pulsar in X-rays.
Expert Solution & Answer
Want to see the full answer?
Check out a sample textbook solution
Students have asked these similar questions
2. A powerful motorcycle can produce an acceleration of 3.50 m/s² while traveling at 90.0 km/h. At that
speed the forces resisting motion, including friction and air resistance, total 400 N. (Air resistance is
analogous to air friction. It always opposes the motion of an object.) What force does the motorcycle
exert backward on the ground to produce its acceleration if the mass of the motorcycle with rider is 245
kg? (10 pts)
a = 3.50 m/s 2
distance 90 km/h
=
3.50m/62
M =
245g
Using Table 17-4, determine the approximate temperature of metal that has formed a dark blue color.
A positively charged disk has a uniform charge per unit area σ.
dq
R
P
x
The total electric field at P is given by the following.
Ek [2 -
x
(R² + x2) 1/2
Sketch the electric field lines in a plane perpendicular to the plane of the disk passing through its center.
Chapter 11 Solutions
Horizons: Exploring the Universe (MindTap Course List)
Ch. 11 - Prob. 1RQCh. 11 - Prob. 2RQCh. 11 - Prob. 3RQCh. 11 - Prob. 4RQCh. 11 - Prob. 5RQCh. 11 - Prob. 6RQCh. 11 - Prob. 7RQCh. 11 - Prob. 8RQCh. 11 - Prob. 9RQCh. 11 - Prob. 10RQ
Ch. 11 - Prob. 11RQCh. 11 - If the Sun has a Schwarzschild radius, why isn’t...Ch. 11 - Prob. 13RQCh. 11 - Prob. 14RQCh. 11 - Prob. 15RQCh. 11 - Prob. 16RQCh. 11 - Prob. 17RQCh. 11 - Prob. 18RQCh. 11 - Prob. 1DQCh. 11 - Prob. 2DQCh. 11 - Prob. 1PCh. 11 - Prob. 2PCh. 11 - Prob. 3PCh. 11 - Prob. 4PCh. 11 - Prob. 5PCh. 11 - Prob. 6PCh. 11 - Prob. 7PCh. 11 - Prob. 8PCh. 11 - Prob. 9PCh. 11 - Prob. 1LTLCh. 11 - Prob. 2LTL
Knowledge Booster
Learn more about
Need a deep-dive on the concept behind this application? Look no further. Learn more about this topic, physics and related others by exploring similar questions and additional content below.Similar questions
- Consider a closed triangular box resting within a horizontal electric field of magnitude E = 8.02 104 N/C as shown in the figure below. A closed right triangular box with its vertical side on the left and downward slope on the right rests within a horizontal electric field vector E that points from left to right. The box has a height of 10.0 cm and a depth of 30.0 cm. The downward slope of the box makes an angle of 60 degrees with the vertical. (a) Calculate the electric flux through the vertical rectangular surface of the box. kN · m2/C(b) Calculate the electric flux through the slanted surface of the box. kN · m2/C(c) Calculate the electric flux through the entire surface of the box. kN · m2/Carrow_forwardThe figure below shows, at left, a solid disk of radius R = 0.600 m and mass 75.0 kg. Tu Mounted directly to it and coaxial with it is a pulley with a much smaller mass and a radius of r = 0.230 m. The disk and pulley assembly are on a frictionless axle. A belt is wrapped around the pulley and connected to an electric motor as shown on the right. The turning motor gives the disk and pulley a clockwise angular acceleration of 1.67 rad/s². The tension T in the upper (taut) segment of the belt is 145 N. (a) What is the tension (in N) in the lower (slack) segment of the belt? N (b) What If? You replace the belt with a different one (one slightly longer and looser, but still tight enough that it does not sag). You again turn on the motor so that the disk accelerates clockwise. The upper segment of the belt once again has a tension of 145 N, but now the tension in the lower belt is exactly zero. What is the magnitude of the angular acceleration (in rad/s²)? rad/s²arrow_forwardA bridge truss extends x = 217 m across a river (shown in the figure below) where 0 = 40°. The structure is free to slide horizontally to permit thermal expansion. The structural components are connected by pin joints, and the masses of the bars are small compared with the mass of a 1300 kg car at the center. Calculate the force of tension or compression in each structural component (in N). B D T T T T T 22820 AB AC BC ||| || || || BD N ---Select--- N ---Select--- N ---Select--- N ---Select--- DE N ---Select--- T DC= N ---Select--- TEC N ---Select--- с ✓ Earrow_forward
- no ai pleasearrow_forwardA block of mass m₁ = 1.85 kg and a block of mass m₂ is 0.360 for both blocks. 5.90 kg are connected by a massless string over a pulley in the shape of a solid disk having a mass of M = 10.0 kg. The fixed, wedge-shaped ramp makes an angle of 0 = 30.0° as shown in the figure. The coefficient of kinetic friction m M, R m2 Ꮎ (a) Determine the acceleration of the two blocks. (Enter the magnitude of the acceleration.) m/s2 (b) Determine the tensions in the string on both sides of the pulley. left of the pulley right of the pulley N Narrow_forwardConsider as a system the Sun with Venus in a circular orbit around it. Find the magnitude of the change in the velocity of the Sun relative to the center of mass of the system during the time Venus completes half an orbit. Assume the mass of the Sun is 5.68 x 1029 kg, the mass of Venus is 4.87 × 1024 kg, its period is 1.94 × 10⁷ s, and the radius of its orbit is 1.08 × 10¹¹ m. Ignore the influence of other celestial objects. m/sarrow_forward
- Your physics instructor loves to put on physics magic shows for elementary school children. He is working on a new trick and has asked you, his star physics student, for assistance. The figure below shows the apparatus he is designing. Cup Hinged end - Support stick A small ball rests on a support so that the center of the ball is at the same height as the upper lip of a cup of negligible mass that is attached to a uniform board of length = 1.89 m. When the support stick is snatched away, the ball will fall and the board will rotate around the hinged end. As the board hits the table, your instructor wants the ball to fall into the cup. The larger the angle 0, the more time the elementary school children will have to watch the progress of the trick. But if the angle is too large, the cup may not pull ahead of the ball. For example, in the limiting case of 90°, the board would not fall at all! (a) Your instructor wishes to know the minimum angle 0 (in degrees) at which the support would…arrow_forwardno ai pleasearrow_forward= Consider the schematic of the molecule shown, with two hydrogen atoms, H, bonded to an oxygen atom, O. The angle between the two bonds is 106°. If the bond length r 0.106 nm long, locate the center of mass of the molecule. The mass mH of the hydrogen atom is 1.008 u, and the mass mo of the oxygen atom is 15.9999 u. (Use a coordinate system centered in the oxygen atom, with the x-axis to the right and the y-axis upward. Give the coordinates of the center of mass in nm.) XCM YOM = = H 53° 53° nm nm r Harrow_forward
- An approximate model for a ceiling fan consists of a cylindrical disk with four thin rods extending from the disk's center, as in the figure below. The disk has mass 2.60 kg and radius 0.200 m. Each rod has mass 0.850 kg and is 0.700 m long. HINT (a) Find the ceiling fan's moment of inertia about a vertical axis through the disk's center. (Enter your answer in kg • m².) kg. m² (b) Friction exerts a constant torque of magnitude 0.113 N m on the fan as it rotates. Find the magnitude of the constant torque provided by the fan's motor if the fan starts from rest and takes 15.0 s and 17.5 full revolutions to reach its maximum speed. (Enter your answer in N. m.) N.marrow_forwardA uniform, thin rod hangs vertically at rest from a frictionless axle attached to its top end. The rod has a mass of 0.780 kg and a length of 1.54 m. (Assume a coordinate system where the +y-direction is up and the +x-direction is to the right. The rod is free to swing about the axle in the x- y plane.) (a) You take a hammer and strike the bottom end of the rod. At the instant the hammer strikes, the force it applies to the rod is (15.71) N. What is the acceleration (in m/s²) of the rod's center of mass at this instant? (Express your answer in vector form.) m/s² a = (b) What is the horizontal force (in N) that the axle exerts on the rod at this same instant? (Express your answer in vector form.) F = N (c) The rod then returns to hanging at rest. You again strike the rod with the hammer, applying the same force, but now you strike it at its midpoint. What now is the acceleration of the center of mass (in m/s²) at the instant of impact? (Express your answer in vector form.) m/s² a = (d)…arrow_forwardFind the net torque on the wheel in the figure below about the axle through O perpendicular to the page, taking a = 9.00 cm and b = 23.0 cm. (Indicate the direction with the sign of your answer. Assume that the positive direction is counterclockwise.) N.m 10.0 N 30.0% 12.0 N 9.00 Narrow_forward
arrow_back_ios
SEE MORE QUESTIONS
arrow_forward_ios
Recommended textbooks for you
 Horizons: Exploring the Universe (MindTap Course ...PhysicsISBN:9781305960961Author:Michael A. Seeds, Dana BackmanPublisher:Cengage Learning
 Stars and Galaxies (MindTap Course List)PhysicsISBN:9781337399944Author:Michael A. SeedsPublisher:Cengage Learning

 Foundations of Astronomy (MindTap Course List)PhysicsISBN:9781337399920Author:Michael A. Seeds, Dana BackmanPublisher:Cengage Learning
 AstronomyPhysicsISBN:9781938168284Author:Andrew Fraknoi; David Morrison; Sidney C. WolffPublisher:OpenStax
 Stars and GalaxiesPhysicsISBN:9781305120785Author:Michael A. Seeds, Dana BackmanPublisher:Cengage Learning

Horizons: Exploring the Universe (MindTap Course ...
Physics
ISBN:9781305960961
Author:Michael A. Seeds, Dana Backman
Publisher:Cengage Learning

Stars and Galaxies (MindTap Course List)
Physics
ISBN:9781337399944
Author:Michael A. Seeds
Publisher:Cengage Learning


Foundations of Astronomy (MindTap Course List)
Physics
ISBN:9781337399920
Author:Michael A. Seeds, Dana Backman
Publisher:Cengage Learning

Astronomy
Physics
ISBN:9781938168284
Author:Andrew Fraknoi; David Morrison; Sidney C. Wolff
Publisher:OpenStax

Stars and Galaxies
Physics
ISBN:9781305120785
Author:Michael A. Seeds, Dana Backman
Publisher:Cengage Learning