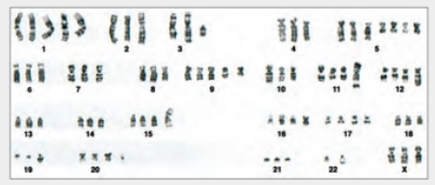
HeLa Cells Are a Genetic Mess HeLa cells can vary in chromosome number. Defects in proteins that orchestrate cell division result in descendant cells with too many or too few chromosomes, an outcome that is one of the ha1lmarks of cancer cells. The panel of chromosomes in FIGURE 11.9, originally published in 1989, shows all of the chromosomes in a single metaphase HeLa cell.

FIGURE 11.9 Karyotype of HeLa showing chromosomes in one cell.
What is the chromosome number of this HeLa cell?
To determine: The number of chromosomes in the HeLa cell.
Concept introduction: HeLa cell is the oldest and most commonly used cell line that was derived from the cervical cancer cells. HeLa cells differ from the normal cells in many ways. These cells have the ability to contaminate other cell lines. These cells have furthered the understanding of cancer, HIV, and the cells in general. It is still used widely to grow viruses and to test anti-tumor medicines.
Answer to Problem 1DAA
Explanation of Solution
Want to see more full solutions like this?
Chapter 11 Solutions
Biology: The Unity and Diversity of Life (MindTap Course List)
Additional Science Textbook Solutions
Biochemistry: Concepts and Connections (2nd Edition)
Genetics: From Genes to Genomes
Campbell Essential Biology (7th Edition)
HUMAN ANATOMY
Microbiology Fundamentals: A Clinical Approach
- How much ATP will be produced during the following metabolic scenario: Aerobic respiration of a 5mM lipid solution that is made up of one glycerol and an 8-carbon fatty acid and 12-carbon fatty acid. Recall that when glycerol breaks down to Glyceraldehyde-3-phosphate it costs one ATP but your get an extra FADH2. Every two carbons of a fatty acid break down to one acetyl-CoA. (pathways will be provided on the exam) Units cannot be entered in this style of question but the units of your answer should be in mM of ATP.arrow_forwardWhen beta-lactamase was isolated from Staphylcoccus aureus and treated with a phosphorylating agent, only the active site, serine was phosphorylated. Additionally, the serine was found to constitute 0.35% (by weight) of this beta-lactamase enzyme. Using this, calculate the molecular weight of this enzyme and estimate the number of amino acids present in the polypeptide.arrow_forwardBased on your results from the Mannitol Salt Agar (MSA) media, which of your bacteria were mannitol fermenters and which were not mannitol fermenters?arrow_forward
- help tutor pleasearrow_forwardQ8. A researcher wants to study the effectiveness of a pill intended to reduce stomach heartburn in pregnant women. The researcher chooses randomly 400 women to participate in this experiment for 9 months of their pregnancy period. They all need to have the same diet. The researcher designs two groups of 200 participants: One group take the real medication intended to reduce heartburn, while the other group take placebo medication. In this study what are: Independent variable: Dependent variable: Control variable: Experimental group: " Control group: If the participants do not know who is consuming the real pills and who is consuming the sugar pills. This study is It happens that 40% of the participants do not find the treatment helpful and drop out after 6 months. The researcher throws out the data from subjects that drop out. What type of bias is there in this study? If the company who makes the medication funds this research, what type of bias might exist in this research work?arrow_forwardHow do I determine the inhertiance pattern from the pedigree diagram?arrow_forward
- 22. Which of the following mutant proteins is expected to have a dominant negative effect when over- expressed in normal cells? a. mutant PI3-kinase that lacks the SH2 domain but retains the kinase function b. mutant Grb2 protein that cannot bind to RTK c. mutant RTK that lacks the extracellular domain d. mutant PDK that has the PH domain but lost the kinase function e. all of the abovearrow_forwardWhat is the label ?arrow_forwardCan you described the image? Can you explain the question as well their answer and how to get to an answer to an problem like this?arrow_forward
 Biology Today and Tomorrow without Physiology (Mi...BiologyISBN:9781305117396Author:Cecie Starr, Christine Evers, Lisa StarrPublisher:Cengage Learning
 Biology: The Unity and Diversity of Life (MindTap...BiologyISBN:9781337408332Author:Cecie Starr, Ralph Taggart, Christine Evers, Lisa StarrPublisher:Cengage Learning
 Biology 2eBiologyISBN:9781947172517Author:Matthew Douglas, Jung Choi, Mary Ann ClarkPublisher:OpenStax
 Biology: The Unity and Diversity of Life (MindTap...BiologyISBN:9781305073951Author:Cecie Starr, Ralph Taggart, Christine Evers, Lisa StarrPublisher:Cengage Learning
 Concepts of BiologyBiologyISBN:9781938168116Author:Samantha Fowler, Rebecca Roush, James WisePublisher:OpenStax College
 Human Biology (MindTap Course List)BiologyISBN:9781305112100Author:Cecie Starr, Beverly McMillanPublisher:Cengage Learning


