
Thinking Like an Engineer: An Active Learning Approach (4th Edition)
4th Edition
ISBN: 9780134639673
Author: Elizabeth A. Stephan, David R. Bowman, William J. Park, Benjamin L. Sill, Matthew W. Ohland
Publisher: PEARSON
expand_more
expand_more
format_list_bulleted
Concept explainers
Videos
Textbook Question
Chapter 11, Problem 10ICA
The following graph applies to ICA 11-10 to ICA 11-15
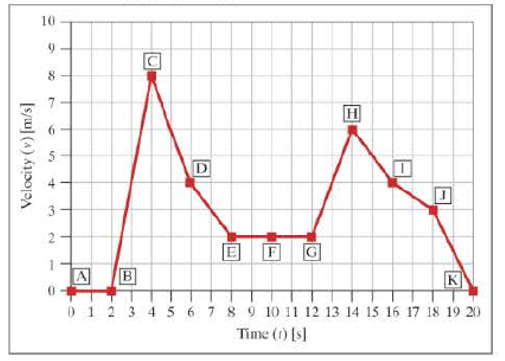
ICA 11-10
- a. Between points A and 8 , the acceleration is
- b. Between points C and 0 , the acceleration is
- c. Between points G and H, the acceleration is
- 1. Zero
- 2. Positive and constant
- 3. Positive and increasing
- 4. Positive and decreasing
- 5. Negative and constant
- 6. Negative with increasing magnitude
- 7. Negative with decreasing magnitude
- 8. Cannot be determined from information given
Expert Solution & Answer
Want to see the full answer?
Check out a sample textbook solution
Students have asked these similar questions
Q1/ A vertical, circular gate with water on one side as shown. Determine
the total resultant force acting on the gate and the location of the center of
pressure, use water specific weight 9.81 kN/m³
1 m
4 m
I need handwritten solution with sketches for each
Given answers to be: i) 14.65 kN; 6.16 kN; 8.46 kN ii) 8.63 kN; 9.88 kN iii) Bearing 6315 for B1 & B2, or Bearing 6215 for B1
Chapter 11 Solutions
Thinking Like an Engineer: An Active Learning Approach (4th Edition)
Ch. 11.2 - In the following experimental data plot, identify...Ch. 11.2 - In the following experimental data plot, identify...Ch. 11.2 - In the following theoretical data plot, identify...Ch. 11.2 - In the following theoretical data plot, identify...Ch. 11.4 - Use the graph to answer the following questions....Ch. 11.5 - Use the graph to answer the following questions....Ch. 11.6 - We assume that the current through two...Ch. 11.6 - You are working for a tire manufacturer, producing...Ch. 11.6 - You want to install a solar panel system on your...Ch. 11 - Joules first law relates the heat generated to...
Ch. 11 - Data for a wind turbine is shown below. Use the...Ch. 11 - There is a large push in the United States to...Ch. 11 - Your team has designed three tennis ball...Ch. 11 - Plot the following pairs of functions on a single...Ch. 11 - Plot the following pairs of functions on a single...Ch. 11 - You need to create a graph showing the...Ch. 11 - The decay of a radioactive isotope can be modeled...Ch. 11 - In researching alternate energies, you find that...Ch. 11 - The following graph applies to ICA 11-10 to ICA...Ch. 11 - The following graph applies to ICA 11-10 to ICA...Ch. 11 - The following graph applies to ICA 11-10 to ICA...Ch. 11 - The following graph applies to ICA 11-10 to ICA...Ch. 11 - The following graph applies to ICA 11-10 to ICA...Ch. 11 - The following graph applies to ICA 11-10 to ICA...Ch. 11 - Use the following graph to determine which...Ch. 11 - The following graph shows the power delivered to a...Ch. 11 - The music industry in the United States has had a...Ch. 11 - You are working for a chemical manufacturer,...Ch. 11 - Use the accompanying graph to answer the following...Ch. 11 - A company designs submersible robots with a new...Ch. 11 - Your company is manufacturing a complex part from...Ch. 11 - For questions 1 through 10, your instructor will...Ch. 11 - 2. Due to increased demand, an industrial engineer...Ch. 11 - 3. An engineer is conducting tests of two...Ch. 11 - 4. Several reactions are carried out in a closed...Ch. 11 - 5. The following experimental data are collected...Ch. 11 - 6. If an object is heated, the temperature of the...Ch. 11 - 7. Eutrophication is the result of excessive...Ch. 11 - 8. In the 1950s, a team at Los Alamos National...Ch. 11 - Prob. 9RQCh. 11 - 10. One of the 22 named, derived units in the...Ch. 11 - Shown are graphs of the altitude in meters, and...Ch. 11 - Answer the following questions using the graph....Ch. 11 - Answer the following questions using the graph....Ch. 11 - In a simple electric circuit, the current (I) must...Ch. 11 - In a hard drive design, the faster the disk spins,...Ch. 11 - We have decided to become entrepreneurs by raising...Ch. 11 - As an engineer, suppose you are directed to design...Ch. 11 - We have obtained a contract to construct metal...Ch. 11 - Your company has developed a new high-mileage...Ch. 11 - One of the 14 Grand Challenges for Engineering as...Ch. 11 - You are an engineer for a plastics manufacturing...Ch. 11 - When a wine generator is installed there is a...
Knowledge Booster


Learn more about
Need a deep-dive on the concept behind this application? Look no further. Learn more about this topic, mechanical-engineering and related others by exploring similar questions and additional content below.Similar questions
- (b) A steel 'hot rolled structural hollow section' column of length 5.75 m, has the cross-section shown in Figure Q.5(b) and supports a load of 750 kN. During service, it is subjected to axial compression loading where one end of the column is effectively restrained in position and direction (fixed) and the other is effectively held in position but not in direction (pinned). i) Given that the steel has a design strength of 275 MN/m², determine the load factor for the structural member based upon the BS5950 design approach using Datasheet Q.5(b). [11] ii) Determine the axial load that can be supported by the column using the Rankine-Gordon formula, given that the yield strength of the material is 280 MN/m² and the constant *a* is 1/30000. [6] 300 600 2-300 mm wide x 5 mm thick plates. Figure Q.5(b) L=5.75m Pinned Fixedarrow_forwardHelp ارجو مساعدتي في حل هذا السؤالarrow_forwardHelp ارجو مساعدتي في حل هذا السؤالarrow_forward
- Q2: For the following figure, find the reactions of the system. The specific weight of the plate is 500 lb/ft³arrow_forwardQ1: For the following force system, find the moments with respect to axes x, y, and zarrow_forwardQ10) Body A weighs 600 lb contact with smooth surfaces at D and E. Determine the tension in the cord and the forces acting on C on member BD, also calculate the reaction at B and F. Cable 6' 3' wwwarrow_forward
- Help ارجو مساعدتي في حل هذا السؤالarrow_forwardQ3: Find the resultant of the force system.arrow_forwardQuestion 1 A three-blade propeller of a diameter of 2 m has an activity factor AF of 200 and its ratio of static thrust coefficient to static torque coefficient is 10. The propeller's integrated lift coefficient is 0.3.arrow_forward
- (L=6847 mm, q = 5331 N/mm, M = 1408549 N.mm, and El = 8.6 x 10¹⁴ N. mm²) X A ΕΙ B L Y Marrow_forwardCalculate the maximum shear stress Tmax at the selected element within the wall (Fig. Q3) if T = 26.7 KN.m, P = 23.6 MPa, t = 2.2 mm, R = 2 m. The following choices are provided in units of MPa and rounded to three decimal places. Select one: ○ 1.2681.818 O 2. 25745.455 O 3. 17163.636 O 4. 10727.273 ○ 5.5363.636arrow_forwardIf L-719.01 mm, = 7839.63 N/m³, the normal stress σ caused by self-weight at the location of the maximum normal stress in the bar can be calculated as (Please select the correct value of σ given in Pa and rounded to three decimal places.) Select one: ○ 1. 1409.193 2. 845.516 O 3. 11273.545 ○ 4.8455.159 ○ 5.4509.418 6. 2818.386 7.5636.772arrow_forward
arrow_back_ios
SEE MORE QUESTIONS
arrow_forward_ios
Recommended textbooks for you
 Elements Of ElectromagneticsMechanical EngineeringISBN:9780190698614Author:Sadiku, Matthew N. O.Publisher:Oxford University Press
 Mechanics of Materials (10th Edition)Mechanical EngineeringISBN:9780134319650Author:Russell C. HibbelerPublisher:PEARSON
 Thermodynamics: An Engineering ApproachMechanical EngineeringISBN:9781259822674Author:Yunus A. Cengel Dr., Michael A. BolesPublisher:McGraw-Hill Education
 Control Systems EngineeringMechanical EngineeringISBN:9781118170519Author:Norman S. NisePublisher:WILEY
 Mechanics of Materials (MindTap Course List)Mechanical EngineeringISBN:9781337093347Author:Barry J. Goodno, James M. GerePublisher:Cengage Learning
 Engineering Mechanics: StaticsMechanical EngineeringISBN:9781118807330Author:James L. Meriam, L. G. Kraige, J. N. BoltonPublisher:WILEY
Elements Of Electromagnetics
Mechanical Engineering
ISBN:9780190698614
Author:Sadiku, Matthew N. O.
Publisher:Oxford University Press
Mechanics of Materials (10th Edition)
Mechanical Engineering
ISBN:9780134319650
Author:Russell C. Hibbeler
Publisher:PEARSON
Thermodynamics: An Engineering Approach
Mechanical Engineering
ISBN:9781259822674
Author:Yunus A. Cengel Dr., Michael A. Boles
Publisher:McGraw-Hill Education
Control Systems Engineering
Mechanical Engineering
ISBN:9781118170519
Author:Norman S. Nise
Publisher:WILEY
Mechanics of Materials (MindTap Course List)
Mechanical Engineering
ISBN:9781337093347
Author:Barry J. Goodno, James M. Gere
Publisher:Cengage Learning
Engineering Mechanics: Statics
Mechanical Engineering
ISBN:9781118807330
Author:James L. Meriam, L. G. Kraige, J. N. Bolton
Publisher:WILEY
Introduction to Diffusion in Solids; Author: Engineering and Design Solutions;https://www.youtube.com/watch?v=K_1QmKJvNjc;License: Standard youtube license