
Thinking Like an Engineer: An Active Learning Approach (4th Edition)
4th Edition
ISBN: 9780134639673
Author: Elizabeth A. Stephan, David R. Bowman, William J. Park, Benjamin L. Sill, Matthew W. Ohland
Publisher: PEARSON
expand_more
expand_more
format_list_bulleted
Videos
Textbook Question
Chapter 11, Problem 14ICA
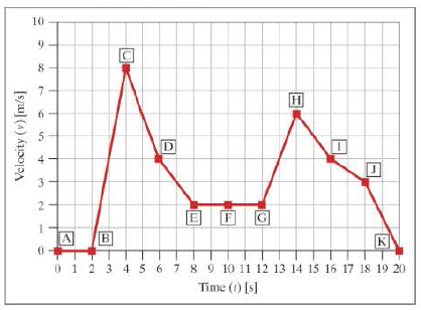 The following graph applies to ICA 11-10 to ICA 11-15
ICA 11-14
- a. Use the graph to determine the numerical value and appropriate unit of the acceleration between points A and B.
- b. Use the graph to determine the numerical value and appropriate unit of the acceleration between points I and J.
- c. Use the graph to determine the numerical value and appropriate unit of the total distance traveled at point G.
- d. Use the graph to determine the numerical value and appropriate unit of the total distance traveled at point K.
Expert Solution & Answer
Want to see the full answer?
Check out a sample textbook solution
Students have asked these similar questions
Please help, make sure it's to box out and make it clear what answers go where...
A triangular distributed load of max intensity w acts on beam
AB. The beam is supported by a pin at A and member CD,
which is connected by pins at C and D respectively.
Determine the largest load intensity, Wmax, that can be
applied if the pin at D can support a maximum force of
18000 N. Also determine the reactions at A and C
and express each answer in Cartesian components. Assume
the masses of both beam and member ✓ are
negligible.
Dwas
шал
=
A
BY NC SA
2016 Eric Davishahl
C
D
-a-
Ур
-b-
X
B
W
Values for dimensions on the figure are given in the following
table. Note the figure may not be to scale.
Variable Value
a
6.6 m
b
11.88 m
C
4.29 m
The maximum load intensity is
=
wmax
N/m.
The reaction at A is A =
The reaction at C is
=
i+
Ĵ N.
ĴN.
12
i+
The beam is supported by a pin at B and a roller at C and is
subjected to the loading shown with w =110 lb/ft, and F
205 lb.
a.) If M
=
2,590 ft-lb, determine the support reactions at B
and C. Report your answers in both Cartesian components.
b.) Determine the largest magnitude of the applied couple M
for which the beam is still properly supported in equilibrium
with the pin and roller as shown.
2013 Michael Swanbom
CC
BY NC SA
M
ру
W
B⚫
C
F
ka
b
Values for dimensions on the figure are given in the following
table. Note the figure may not be to scale.
Variable Value
a
3.2 ft
b
6.4 ft
C
3 ft
a.) The reaction at B is B =
The reaction at C is C =
ĵ lb.
i+
Ĵ lb.
b.) The largest couple that can be applied is M
ft-lb.
==
i+
Chapter 11 Solutions
Thinking Like an Engineer: An Active Learning Approach (4th Edition)
Ch. 11.2 - In the following experimental data plot, identify...Ch. 11.2 - In the following experimental data plot, identify...Ch. 11.2 - In the following theoretical data plot, identify...Ch. 11.2 - In the following theoretical data plot, identify...Ch. 11.4 - Use the graph to answer the following questions....Ch. 11.5 - Use the graph to answer the following questions....Ch. 11.6 - We assume that the current through two...Ch. 11.6 - You are working for a tire manufacturer, producing...Ch. 11.6 - You want to install a solar panel system on your...Ch. 11 - Joules first law relates the heat generated to...
Ch. 11 - Data for a wind turbine is shown below. Use the...Ch. 11 - There is a large push in the United States to...Ch. 11 - Your team has designed three tennis ball...Ch. 11 - Plot the following pairs of functions on a single...Ch. 11 - Plot the following pairs of functions on a single...Ch. 11 - You need to create a graph showing the...Ch. 11 - The decay of a radioactive isotope can be modeled...Ch. 11 - In researching alternate energies, you find that...Ch. 11 - The following graph applies to ICA 11-10 to ICA...Ch. 11 - The following graph applies to ICA 11-10 to ICA...Ch. 11 - The following graph applies to ICA 11-10 to ICA...Ch. 11 - The following graph applies to ICA 11-10 to ICA...Ch. 11 - The following graph applies to ICA 11-10 to ICA...Ch. 11 - The following graph applies to ICA 11-10 to ICA...Ch. 11 - Use the following graph to determine which...Ch. 11 - The following graph shows the power delivered to a...Ch. 11 - The music industry in the United States has had a...Ch. 11 - You are working for a chemical manufacturer,...Ch. 11 - Use the accompanying graph to answer the following...Ch. 11 - A company designs submersible robots with a new...Ch. 11 - Your company is manufacturing a complex part from...Ch. 11 - For questions 1 through 10, your instructor will...Ch. 11 - 2. Due to increased demand, an industrial engineer...Ch. 11 - 3. An engineer is conducting tests of two...Ch. 11 - 4. Several reactions are carried out in a closed...Ch. 11 - 5. The following experimental data are collected...Ch. 11 - 6. If an object is heated, the temperature of the...Ch. 11 - 7. Eutrophication is the result of excessive...Ch. 11 - 8. In the 1950s, a team at Los Alamos National...Ch. 11 - Prob. 9RQCh. 11 - 10. One of the 22 named, derived units in the...Ch. 11 - Shown are graphs of the altitude in meters, and...Ch. 11 - Answer the following questions using the graph....Ch. 11 - Answer the following questions using the graph....Ch. 11 - In a simple electric circuit, the current (I) must...Ch. 11 - In a hard drive design, the faster the disk spins,...Ch. 11 - We have decided to become entrepreneurs by raising...Ch. 11 - As an engineer, suppose you are directed to design...Ch. 11 - We have obtained a contract to construct metal...Ch. 11 - Your company has developed a new high-mileage...Ch. 11 - One of the 14 Grand Challenges for Engineering as...Ch. 11 - You are an engineer for a plastics manufacturing...Ch. 11 - When a wine generator is installed there is a...
Additional Engineering Textbook Solutions
Find more solutions based on key concepts
Consider the adage Never ask a question for which you do not want the answer. a. Is following that adage ethica...
Experiencing MIS
Why is the study of database technology important?
Database Concepts (8th Edition)
Assume a telephone signal travels through a cable at two-thirds the speed of light. How long does it take the s...
Electric Circuits. (11th Edition)
What are the design issues for character string types?
Concepts Of Programming Languages
17–1C A high-speed aircraft is cruising in still air. How does the temperature of air at the nose of the aircra...
Thermodynamics: An Engineering Approach
How are relationships between tables expressed in a relational database?
Modern Database Management
Knowledge Booster


Learn more about
Need a deep-dive on the concept behind this application? Look no further. Learn more about this topic, mechanical-engineering and related others by exploring similar questions and additional content below.Similar questions
- The beam ABC has a mass of 79.0 kg and is supported by the rope BDC that runs through the frictionless pulley at D . The winch at C has a mass of 36.5 kg. The tension in the rope acts on the beam at points B and C and counteracts the moments due to the beam's weight (acting vertically at the midpoint of its length) and the weight of the winch (acting vertically at point C) such that the resultant moment about point A is equal to zero. Assume that rope segment CD is vertical and note that rope segment BD is NOT necessarily perpendicular to the beam. a.) Compute the tension in the rope. b.) Model the two forces the rope exerts on the beam as a single equivalent force and couple moment acting at point B. Enter your answer in Cartesian components. c.) Model the two forces the rope exerts on the beam as a single equivalent force (no couple) and determine the distance from A to the point along the beam where the equivalent force acts (measured parallel to the beam from A ). Enter your answer…arrow_forwardw1 Three distributed loads act on a beam as shown. The load between A and B increases linearly from 0 to a maximum intensity of w₁ = 12.8 lb/ft at point B. The load then varies linearly with a different slope to an intensity of w₂ = 17.1 lb/ft at C. The load intensity in section CD of the beam is constant at w3 10.2 lb/ft. For each load region, determine the resultant force and the location of its line of action (distance to the right of A for all cases). cc 10 BY NC SA 2016 Eric Davishahl = WI W2 W3 -b- C Values for dimensions on the figure are given in the following table. Note the figure may not be to scale. Variable Value a 4.50 ft b 5.85 ft с 4.28 ft The resultant load in region AB is FR₁ = lb and acts ft to the right of A. The resultant load in region BC is FR2 lb and acts = ft to the right of A. The resultant load in region CD is FR3 = lb and acts ft to the right of A.arrow_forwardThe T-shaped structure is embedded in a concrete wall at A and subjected to the force F₁ and the force-couple system F2 1650 N and M = 1,800 N-m at the locations shown. Neglect the weight of the structure in your calculations for this problem. = a.) Compute the allowable range of magnitudes for F₁ in the direction shown if the connection at A will fail when subjected to a resultant moment with a magnitude of 920 N- m or higher. b.) Focusing on the forces and igonoring given M for now. Using the value for F1, min that you calculated in (a), replace the two forces F₁ and F2 with a single force that has equivalent effect on the structure. Specify the equivalent →> force Feq in Cartesian components and indicate the horizontal distance from point A to its line of action (note this line of action may not intersect the structure). c.) Now, model the entire force system (F1,min, F2, and M) as a single force and couple acting at the junction of the horizontal and vertical sections of the…arrow_forward
- The heated rod from Problem 3 is subject to a volumetric heating h(x) = h0 x L in units of [Wm−3], as shown in the figure below. Under the heat supply the temperature of the rod changes along x with the temperature function T (x). The temperature T (x) is governed by the d following equations: − dx (q(x)) + h(x) = 0 PDE q(x) =−k dT dx Fourier’s law of heat conduction (4) where q(x) is the heat flux through the rod and k is the (constant) thermal conductivity. Both ends of the bar are in contact with a heat reservoir at zero temperature. Determine: 1. Appropriate BCs for this physical problem. 2. The temperature function T (x). 3. The heat flux function q(x). Side Note: Please see that both ends of bar are in contact with a heat reservoir at zero temperature so the boundary condition at the right cannot be du/dx=0 because its not thermally insulated. Thank youarrow_forwardThe elastic bar from Problem 1 spins with angular velocity ω about an axis, as shown in the figure below. The radial acceleration at a generic point x along the bar is a(x) = ω2x. Under this radial acceleration, the bar stretches along x with displacement function u(x). The displacement d u(x) is governed by the following equations: dx (σ(x)) + ρa(x) = 0 PDE σ(x) = E du dx Hooke’s law (2) where σ(x) is the axial stress in the rod, ρ is the mass density, and E is the (constant) Young’s modulus. The bar is pinned on the rotation axis at x = 0 and it is also pinned at x = L. Determine: 1. Appropriate BCs for this physical problem. 2. The displacement function u(x). 3. The stress function σ(x). SIDE QUESTION: I saw a tutor solve it before but I didn't understand why the tutor did not divide E under the second term (c1x) before finding u(x). The tutor only divided E under first term. please explain and thank youarrow_forwardcalculate the total power required to go 80 mph in a VW Type 2 Samba Bus weighing 2310 lbs. with a Cd of 0.35 and a frontal area of 30ft^2. Consider the coefficient of rolling resistance to be 0.018. What is the increase in power required to go the same speed if the weight is increased by 2205 pounds (the rated carrying capacity of the vehicle). If the rated power for the vehicle is 49 bhp, will the van be able to reach 80 mph at full carrying capacity?arrow_forward
- A distillation column with a total of 13 actual stages (including a partial condenser) is used to perform a separation which requires 7 ideal stages. Calculate the overall column efficiency, and report your answer in %arrow_forward6. Consider a 10N step input to the mechanical system shown below, take M = 15kg, K = 135N/m, and b = 0.4 Ns/m. (a) Assume zero initial condition, calculate the (i) System pole (ii) System characterization, and (iii) The time domain response (b) Calculate the steady-state value of the system b [ www K 个 х M -F(+)arrow_forward2. Solve the following linear time invariant differential equations using Laplace transforms subject to different initial conditions (a) y-y=t for y(0) = 1 and y(0) = 1 (b) ÿ+4y+ 4y = u(t) for y(0) = 0 and y(0) = 1 (c) y-y-2y=0 for y(0) = 1 and y(0) = 0arrow_forward
- 3. For the mechanical systems shown below, the springs are undeflected when x₁ = x2 = x3 = 0 and the input is given as fa(t). Draw the free-body diagrams and write the modeling equations governing each of the systems. K₁ 000 K₂ 000 M₁ M2 -fa(t) B₂ B₁ (a) fa(t) M2 K₂ 000 B K₁ x1 000 M₁ (b)arrow_forwardThis question i m uploading second time . before you provide me incorrect answer. read the question carefully and solve accordily.arrow_forward1. Create a table comparing five different analogous variables for translational, rotational, electrical and fluid systems. Include the standard symbols for each variable in their respective systems.arrow_forward
arrow_back_ios
SEE MORE QUESTIONS
arrow_forward_ios
Recommended textbooks for you
 Elements Of ElectromagneticsMechanical EngineeringISBN:9780190698614Author:Sadiku, Matthew N. O.Publisher:Oxford University Press
 Mechanics of Materials (10th Edition)Mechanical EngineeringISBN:9780134319650Author:Russell C. HibbelerPublisher:PEARSON
 Thermodynamics: An Engineering ApproachMechanical EngineeringISBN:9781259822674Author:Yunus A. Cengel Dr., Michael A. BolesPublisher:McGraw-Hill Education
 Control Systems EngineeringMechanical EngineeringISBN:9781118170519Author:Norman S. NisePublisher:WILEY
 Mechanics of Materials (MindTap Course List)Mechanical EngineeringISBN:9781337093347Author:Barry J. Goodno, James M. GerePublisher:Cengage Learning
 Engineering Mechanics: StaticsMechanical EngineeringISBN:9781118807330Author:James L. Meriam, L. G. Kraige, J. N. BoltonPublisher:WILEY
Elements Of Electromagnetics
Mechanical Engineering
ISBN:9780190698614
Author:Sadiku, Matthew N. O.
Publisher:Oxford University Press
Mechanics of Materials (10th Edition)
Mechanical Engineering
ISBN:9780134319650
Author:Russell C. Hibbeler
Publisher:PEARSON
Thermodynamics: An Engineering Approach
Mechanical Engineering
ISBN:9781259822674
Author:Yunus A. Cengel Dr., Michael A. Boles
Publisher:McGraw-Hill Education
Control Systems Engineering
Mechanical Engineering
ISBN:9781118170519
Author:Norman S. Nise
Publisher:WILEY
Mechanics of Materials (MindTap Course List)
Mechanical Engineering
ISBN:9781337093347
Author:Barry J. Goodno, James M. Gere
Publisher:Cengage Learning
Engineering Mechanics: Statics
Mechanical Engineering
ISBN:9781118807330
Author:James L. Meriam, L. G. Kraige, J. N. Bolton
Publisher:WILEY
Heat Transfer – Conduction, Convection and Radiation; Author: NG Science;https://www.youtube.com/watch?v=Me60Ti0E_rY;License: Standard youtube license