
Concept explainers
Videos
To discuss the conditional frequency are better than simple relative frequencies.
Explanation of Solution
Given information:
Discuss the conditional frequency are better than simple relative frequencies.
The relative frequency describes the proportion of the subjects jointly classified by a category of X and a category of Y where X and Y are two variables. The cells of the
The conditional frequency describe the frequency of one variable given the levels of the other variable. The cells of the contingency table divided by the row or column totals provide the conditional frequency. The sum of a conditional frequency is 1.
When both variables are random, you can describe the data using the relative frequency, the conditional frequency of Y given X, or the conditional distribution of X given Y.
When one variable is and explanatory variable (X, fixed) and the other a response variable (Y, random), the notion of a relative frequency is meaningless, and you should describe the data using the conditional frequency of Y given X.
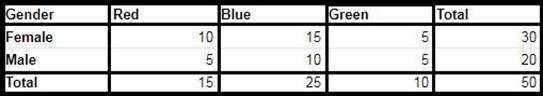
consider two way frequency table of t-shirt sold:
Calculation:
1)Find number of females
2)Find out each conditional frequencies
Calculation:
The percentage female, give the preference for red:
Total red T-shirt sold=15,
Red T-shirt sold to females=10
Then, the percentage female, give the preference for red
Calculation:
The percentage female, give the preference for blue:
Total red t-shirt sold=25
Total blue t-shir sold to females=15
Then, the percentage female, give the preference for blue
Calculation:
The percentage female, give the preference for green:
Total red t-shirt sold=10
total green t-shir sold to females=5
Then, the percentage female, give the preference for green
Interpretation:
3)Interpret the result by comparing each conditional frequency to the percentage of all t-shirt sold to females.
-The percentage of females who prefer red is 67% that's greater than total female of 60%.
Hence, Gender appears to influence shirt color.
-The percentage of females who prefer blue is 60% that's same as total female of 60%.
Hence, Gender doesn't appears to influence shirt color.
-The percentage of females who prefer green is 50% that's less than total female of 60%.
Hence, Gender appears to influence shirt color.
When the conditional frequencies for the row are the same or similar the variables are not associated with each other.
Chapter 10 Solutions
Algebra 1, Homework Practice Workbook (MERRILL ALGEBRA 1)
Additional Math Textbook Solutions
Elementary Statistics (13th Edition)
Intro Stats, Books a la Carte Edition (5th Edition)
Basic Business Statistics, Student Value Edition
Algebra and Trigonometry (6th Edition)
Introductory Statistics
College Algebra with Modeling & Visualization (5th Edition)


- The Course Name Real Analysis please Solve questions by Real Analysisarrow_forwardpart 3 of the question is: A power outage occurs 6 min after the ride started. Passengers must wait for their cage to be manually cranked into the lowest position in order to exit the ride. Sine function model: where h is the height of the last passenger above the ground measured in feet and t is the time of operation of the ride in minutes. What is the height of the last passenger at the moment of the power outage? Verify your answer by evaluating the sine function model. Will the last passenger to board the ride need to wait in order to exit the ride? Explain.arrow_forward2. The duration of the ride is 15 min. (a) How many times does the last passenger who boarded the ride make a complete loop on the Ferris wheel? (b) What is the position of that passenger when the ride ends?arrow_forward
- 3. A scientist recorded the movement of a pendulum for 10 s. The scientist began recording when the pendulum was at its resting position. The pendulum then moved right (positive displacement) and left (negative displacement) several times. The pendulum took 4 s to swing to the right and the left and then return to its resting position. The pendulum's furthest distance to either side was 6 in. Graph the function that represents the pendulum's displacement as a function of time. Answer: f(t) (a) Write an equation to represent the displacement of the pendulum as a function of time. (b) Graph the function. 10 9 8 7 6 5 4 3 2 1 0 t 1 2 3 4 5 6 7 8 9 10 11 12 13 14 15 -1 -5. -6 -7 -8 -9 -10-arrow_forwardA power outage occurs 6 min after the ride started. Passengers must wait for their cage to be manually cranked into the lowest position in order to exit the ride. Sine function model: h = −82.5 cos (3πt) + 97.5 where h is the height of the last passenger above the ground measured in feet and t is the time of operation of the ride in minutes. (a) What is the height of the last passenger at the moment of the power outage? Verify your answer by evaluating the sine function model. (b) Will the last passenger to board the ride need to wait in order to exit the ride? Explain.arrow_forwardThe Colossus Ferris wheel debuted at the 1984 New Orleans World's Fair. The ride is 180 ft tall, and passengers board the ride at an initial height of 15 ft above the ground. The height above ground, h, of a passenger on the ride is a periodic function of time, t. The graph displays the height above ground of the last passenger to board over the course of the 15 min ride. Height of Passenger in Ferris Wheel 180 160 140- €120 Height, h (ft) 100 80 60 40 20 0 ך 1 2 3 4 5 6 7 8 9 10 11 12 13 14 15 Time of operation, t (min) Sine function model: h = −82.5 cos (3πt) + 97.5 where h is the height of the passenger above the ground measured in feet and t is the time of operation of the ride in minutes. What is the period of the sine function model? Interpret the period you found in the context of the operation of the Ferris wheel. Answer:arrow_forward
- 1. Graph the function f(x)=sin(x) −2¸ Answer: y -2π 一元 1 −1 -2 -3 -4+ 元 2πarrow_forward3. Graph the function f(x) = −(x-2)²+4 Answer: f(x) 6 5 4 3 2+ 1 -6-5 -4-3-2-1 × 1 2 3 4 5 6 -1 -2+ ရာ -3+ -4+ -5 -6arrow_forward2. Graph the function f(x) = cos(2x)+1 Answer: -2π 一元 y 3 2- 1 -1 -2+ ရာ -3- Π 2πarrow_forward
- 2. Graph the function f(x) = |x+1+2 Answer: -6-5-4-3-2-1 f(x) 6 5 4 3 2 1 1 2 3 4 5 6 -1 -2 -3 -4 -5 -6arrow_forward1. The table shows values of a function f(x). What is the average rate of change of f(x) over the interval from x = 5 to x = 9? Show your work. X 4 f(x) LO 5 6 7 8 9 10 -2 8 10 11 14 18arrow_forward• Find a real-world situation that can be represented by a sinusoidal function. You may find something online that represents a sinusoidal graph or you can create a sinusoidal graph yourself with a measuring tape and a rope. • Provide a graph complete with labels and units for the x- and y-axes. • Describe the amplitude, period, and vertical shift in terms of the real-world situation.arrow_forward
 Algebra and Trigonometry (6th Edition)AlgebraISBN:9780134463216Author:Robert F. BlitzerPublisher:PEARSON
 Contemporary Abstract AlgebraAlgebraISBN:9781305657960Author:Joseph GallianPublisher:Cengage Learning
 Linear Algebra: A Modern IntroductionAlgebraISBN:9781285463247Author:David PoolePublisher:Cengage Learning
 Algebra And Trigonometry (11th Edition)AlgebraISBN:9780135163078Author:Michael SullivanPublisher:PEARSON
 Introduction to Linear Algebra, Fifth EditionAlgebraISBN:9780980232776Author:Gilbert StrangPublisher:Wellesley-Cambridge Press
 College Algebra (Collegiate Math)AlgebraISBN:9780077836344Author:Julie Miller, Donna GerkenPublisher:McGraw-Hill Education