
Concept explainers
Videos
To explain the mean and standard deviation are used to compare the center and spread of two symmetrical distribution and The five number summary is used to compare the center and spread of two skewed distributions or a symmetric distribution and a skewed distribution.
Explanation of Solution
Given information:
1)The mean and standard deviation are used to compare the center and spread of two symmetrical distribution.
2)The five number summary is used to compare the center and spread of two skewed distributions or a symmetric distribution and a skewed distribution:
Standard deviation measures the spread of a data distribution. The more spread out a data distribution is, the greater its standard deviation.
For example, the blue distribution on bottom has a greater standard deviation (SD) than the green distribution on top:
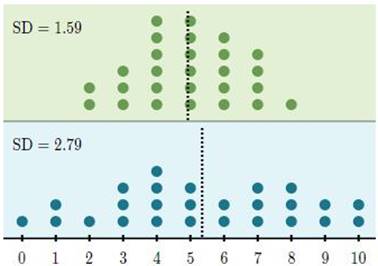
Interestingly, standard deviation cannot be negative. A standard deviation close to 000 indicates that the data points tend to be close to the mean (shown by the dotted line). The further the data points are from the mean, the greater the standard deviation.
In the five number summary the numbers chosen are to help us know the center of our data, as well as how spread out the data points are. With this in mind, the five-number summary consists of five values: the most extreme values in the data set (the maximum and minimum values), the lower and upper quartiles, and the median.
Center of distribution tells about the center or median of the data and spread of distribution tells about spread of data in the graph.
Skewed distribution skewed more data on one side rather than the other.
When we have two skewed distribution center is median and in five number summary center is median due center is same as median.So, the five number summary is best way to comapre.
Symmetrical distribution occurs when the values of variables occur at regular frequencies and the mean, median and mode occur at the same point.Due to the mean, median and mode occur at the same point the five number summary is convenient to compare a symmetric distribution and a skewed distribution.
Chapter 10 Solutions
Algebra 1, Homework Practice Workbook (MERRILL ALGEBRA 1)
Additional Math Textbook Solutions
Basic Business Statistics, Student Value Edition
Algebra and Trigonometry (6th Edition)
Elementary Statistics (13th Edition)
A Problem Solving Approach To Mathematics For Elementary School Teachers (13th Edition)
Calculus: Early Transcendentals (2nd Edition)


- The Course Name Real Analysis please Solve questions by Real Analysisarrow_forwardpart 3 of the question is: A power outage occurs 6 min after the ride started. Passengers must wait for their cage to be manually cranked into the lowest position in order to exit the ride. Sine function model: where h is the height of the last passenger above the ground measured in feet and t is the time of operation of the ride in minutes. What is the height of the last passenger at the moment of the power outage? Verify your answer by evaluating the sine function model. Will the last passenger to board the ride need to wait in order to exit the ride? Explain.arrow_forward2. The duration of the ride is 15 min. (a) How many times does the last passenger who boarded the ride make a complete loop on the Ferris wheel? (b) What is the position of that passenger when the ride ends?arrow_forward
- 3. A scientist recorded the movement of a pendulum for 10 s. The scientist began recording when the pendulum was at its resting position. The pendulum then moved right (positive displacement) and left (negative displacement) several times. The pendulum took 4 s to swing to the right and the left and then return to its resting position. The pendulum's furthest distance to either side was 6 in. Graph the function that represents the pendulum's displacement as a function of time. Answer: f(t) (a) Write an equation to represent the displacement of the pendulum as a function of time. (b) Graph the function. 10 9 8 7 6 5 4 3 2 1 0 t 1 2 3 4 5 6 7 8 9 10 11 12 13 14 15 -1 -5. -6 -7 -8 -9 -10-arrow_forwardA power outage occurs 6 min after the ride started. Passengers must wait for their cage to be manually cranked into the lowest position in order to exit the ride. Sine function model: h = −82.5 cos (3πt) + 97.5 where h is the height of the last passenger above the ground measured in feet and t is the time of operation of the ride in minutes. (a) What is the height of the last passenger at the moment of the power outage? Verify your answer by evaluating the sine function model. (b) Will the last passenger to board the ride need to wait in order to exit the ride? Explain.arrow_forwardThe Colossus Ferris wheel debuted at the 1984 New Orleans World's Fair. The ride is 180 ft tall, and passengers board the ride at an initial height of 15 ft above the ground. The height above ground, h, of a passenger on the ride is a periodic function of time, t. The graph displays the height above ground of the last passenger to board over the course of the 15 min ride. Height of Passenger in Ferris Wheel 180 160 140- €120 Height, h (ft) 100 80 60 40 20 0 ך 1 2 3 4 5 6 7 8 9 10 11 12 13 14 15 Time of operation, t (min) Sine function model: h = −82.5 cos (3πt) + 97.5 where h is the height of the passenger above the ground measured in feet and t is the time of operation of the ride in minutes. What is the period of the sine function model? Interpret the period you found in the context of the operation of the Ferris wheel. Answer:arrow_forward
- 1. Graph the function f(x)=sin(x) −2¸ Answer: y -2π 一元 1 −1 -2 -3 -4+ 元 2πarrow_forward3. Graph the function f(x) = −(x-2)²+4 Answer: f(x) 6 5 4 3 2+ 1 -6-5 -4-3-2-1 × 1 2 3 4 5 6 -1 -2+ ရာ -3+ -4+ -5 -6arrow_forward2. Graph the function f(x) = cos(2x)+1 Answer: -2π 一元 y 3 2- 1 -1 -2+ ရာ -3- Π 2πarrow_forward
- 2. Graph the function f(x) = |x+1+2 Answer: -6-5-4-3-2-1 f(x) 6 5 4 3 2 1 1 2 3 4 5 6 -1 -2 -3 -4 -5 -6arrow_forward1. The table shows values of a function f(x). What is the average rate of change of f(x) over the interval from x = 5 to x = 9? Show your work. X 4 f(x) LO 5 6 7 8 9 10 -2 8 10 11 14 18arrow_forward• Find a real-world situation that can be represented by a sinusoidal function. You may find something online that represents a sinusoidal graph or you can create a sinusoidal graph yourself with a measuring tape and a rope. • Provide a graph complete with labels and units for the x- and y-axes. • Describe the amplitude, period, and vertical shift in terms of the real-world situation.arrow_forward
 Algebra and Trigonometry (6th Edition)AlgebraISBN:9780134463216Author:Robert F. BlitzerPublisher:PEARSON
 Contemporary Abstract AlgebraAlgebraISBN:9781305657960Author:Joseph GallianPublisher:Cengage Learning
 Linear Algebra: A Modern IntroductionAlgebraISBN:9781285463247Author:David PoolePublisher:Cengage Learning
 Algebra And Trigonometry (11th Edition)AlgebraISBN:9780135163078Author:Michael SullivanPublisher:PEARSON
 Introduction to Linear Algebra, Fifth EditionAlgebraISBN:9780980232776Author:Gilbert StrangPublisher:Wellesley-Cambridge Press
 College Algebra (Collegiate Math)AlgebraISBN:9780077836344Author:Julie Miller, Donna GerkenPublisher:McGraw-Hill Education