
To perform:
A hypothesis test.
Answer to Problem 15E
Solution:
a.
b. Chi- square distribution;
c.
d.
Explanation of Solution
Consider the following scenario,
“A health club needs to ensure that the temperature in its heated pool stays constant throughout the winter months. Otherwise it needs to invest in a new heater for the pool. It is assumed that the daily water temperatures, measured in degrees Fahrenheit
a: State the null and alternative hypothesis.
Suppose pool manager claims that variance in the temperature is not 2.25. That is the research hypothesis
The Null hypothesis:
The altenative hypotheis:
b: Determine which distribution to use for the test statistic, and state the level of significance.
Since we are testing a population variance and we are told we can safely assume that all necessary conditions are met, we can use the chi- square distribution and thus the
c: Gather data and calculate the necessary sample statistics.
The test statistic formula:
Test statistic for a hypothesis test for a population variance or population stadard deviation
When the sample taken is a simple random sample and the population distribution is approximately normal, the test statistic for a hypothesis test for a population variance or population standard deviation is given by,
Where n is the sample size,
The given information is,
Substitute these values in the test statistic formula to get the following,
d: Draw a conclusion and interpret the decision.
Rejection Region for Hypothesis Tests for Population Variances and Standard Deviations:
Reject the null hypothesis,
Degrees of Freedom for a Hypothesis Test for a Population Variance or Population Standard Deviation
In a hypothesis test for a population variance or population standard deviation the number of degrees of freedom for the chi- square distribution of the test statistic is given by
Where n is the sample size.
Form the given information this is the two-tailed test since
From the given information n = 15.
The degrees of freedom is given below,
Conclusion:
Use the level of significance of
Use the “Area to the right of the critical value
Use the level of significance of
Use the “Area to the right of the critical value
Therefore, the decision rule is to reject the null hypothesis
So, the left-hand critical value of the test statistic is
The calculated test statistic is
The diagrammatic representation is given below,
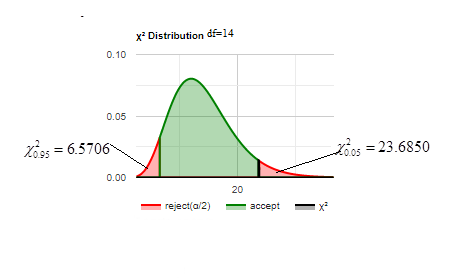
By using the above condition we reject the null hypothesis.
Since
So, there is sufficient evidence to support the manager’s claim that the variance in the water temperature is no longer 2.25.
Final statement:
There is sufficient evidence to support the manager’s claim that the variance in the water temperature is no longer 2.25.
Want to see more full solutions like this?
Chapter 10 Solutions
Beginning Statistics, 2nd Edition

- Find the critical value for a left-tailed test using the F distribution with a 0.025, degrees of freedom in the numerator=12, and degrees of freedom in the denominator = 50. A portion of the table of critical values of the F-distribution is provided. Click the icon to view the partial table of critical values of the F-distribution. What is the critical value? (Round to two decimal places as needed.)arrow_forwardA retail store manager claims that the average daily sales of the store are $1,500. You aim to test whether the actual average daily sales differ significantly from this claimed value. You can provide your answer by inserting a text box and the answer must include: Null hypothesis, Alternative hypothesis, Show answer (output table/summary table), and Conclusion based on the P value. Showing the calculation is a must. If calculation is missing,so please provide a step by step on the answers Numerical answers in the yellow cellsarrow_forwardShow all workarrow_forward
- Show all workarrow_forwardplease find the answers for the yellows boxes using the information and the picture belowarrow_forwardA marketing agency wants to determine whether different advertising platforms generate significantly different levels of customer engagement. The agency measures the average number of daily clicks on ads for three platforms: Social Media, Search Engines, and Email Campaigns. The agency collects data on daily clicks for each platform over a 10-day period and wants to test whether there is a statistically significant difference in the mean number of daily clicks among these platforms. Conduct ANOVA test. You can provide your answer by inserting a text box and the answer must include: also please provide a step by on getting the answers in excel Null hypothesis, Alternative hypothesis, Show answer (output table/summary table), and Conclusion based on the P value.arrow_forward
 MATLAB: An Introduction with ApplicationsStatisticsISBN:9781119256830Author:Amos GilatPublisher:John Wiley & Sons Inc
 Probability and Statistics for Engineering and th...StatisticsISBN:9781305251809Author:Jay L. DevorePublisher:Cengage Learning
 Statistics for The Behavioral Sciences (MindTap C...StatisticsISBN:9781305504912Author:Frederick J Gravetter, Larry B. WallnauPublisher:Cengage Learning
 Elementary Statistics: Picturing the World (7th E...StatisticsISBN:9780134683416Author:Ron Larson, Betsy FarberPublisher:PEARSON
 The Basic Practice of StatisticsStatisticsISBN:9781319042578Author:David S. Moore, William I. Notz, Michael A. FlignerPublisher:W. H. Freeman
 Introduction to the Practice of StatisticsStatisticsISBN:9781319013387Author:David S. Moore, George P. McCabe, Bruce A. CraigPublisher:W. H. Freeman