
Videos
(a)
Interpretation:
The 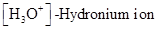 and
and  values of given solution should be determined and the most acidic and basic solution should be identified.
Concept Introduction:
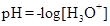
 : The concentration of hydrogen ion is measured using
  scale. The
  of a solution is a figure that expresses the acidity or the alkalinity of a given solution.
It is defined as the negative base-10 logarithm of the hydrogen or hydronium ion concentration.
If the value of is less than , then the solution is acidic whereas if the value of is greater than, then the solution is basic.
Ionic-product constant for water: It is the hydronium ion concentration times the  concentration present in the solution.
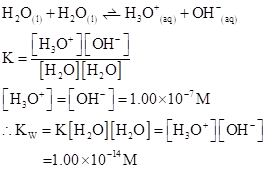
The  will apply to all aqueous solution.
For acidic solution  is large that is
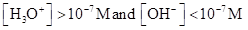
For basic solution  is large that is
(b)
Interpretation:
The and values of given solution should be determined and the most acidic and basic solution should be identified.
Concept Introduction:
: The concentration of hydrogen ion is measured using scale. The of a solution is a figure that expresses the acidity or the alkalinity of a given solution.
It is defined as the negative base-10 logarithm of the hydrogen or hydronium ion concentration.
If the value of is less than, then the solution is acidic whereas if the value of is greater than, then the solution is basic.
Ionic-product constant for water: It is the hydronium ion concentration times the concentration present in the solution.
The will apply to all aqueous solution.
For acidic solution is large that is
For basic solution is large that is
(c)
Interpretation:
The and values of given solution should be determined and the most acidic and basic solution should be identified.
Concept Introduction:
: The concentration of hydrogen ion is measured using scale. The of a solution is a figure that expresses the acidity or the alkalinity of a given solution.
It is defined as the negative base-10 logarithm of the hydrogen or hydronium ion concentration.
If the value of is less than, then the solution is acidic whereas if the value of is greater than, then the solution is basic.
Ionic-product constant for water: It is the hydronium ion concentration times the concentration present in the solution.
The will apply to all aqueous solution.
For acidic solution is large that is
For basic solution is large that is
Want to see the full answer?
Check out a sample textbook solution
Chapter 10 Solutions
EBK FUNDAMENTALS OF GENERAL, ORGANIC, A


- Which type of enzyme catalyses the following reaction? oxidoreductase, transferase, hydrolase, lyase, isomerase, or ligase.arrow_forward+NH+ CO₂ +P H₂N + ATP H₂N NH₂ +ADParrow_forwardWhich type of enzyme catalyses the following reaction? oxidoreductase, transferase, hydrolase, lyase, isomerase, or ligase.arrow_forward
- Which features of the curves in Figure 30-2 indicates that the enzyme is not consumed in the overall reaction? ES is lower in energy that E + S and EP is lower in energy than E + P. What does this tell you about the stability of ES versus E + S and EP versus E + P.arrow_forwardLooking at the figure 30-5 what intermolecular forces are present between the substrate and the enzyme and the substrate and cofactors.arrow_forwardprovide short answers to the followings Urgent!arrow_forward
- Pyruvate is accepted into the TCA cycle by a “feeder” reaction using the pyruvatedehydrogenase complex, resulting in acetyl-CoA and CO2. Provide a full mechanismfor this reaction utilizing the TPP cofactor. Include the roles of all cofactors.arrow_forwardB- Vitamins are converted readily into important metabolic cofactors. Deficiency inany one of them has serious side effects. a. The disease beriberi results from a vitamin B 1 (Thiamine) deficiency and ischaracterized by cardiac and neurological symptoms. One key diagnostic forthis disease is an increased level of pyruvate and α-ketoglutarate in thebloodstream. How does this vitamin deficiency lead to increased serumlevels of these factors? b. What would you expect the effect on the TCA intermediates for a patientsuffering from vitamin B 5 deficiency? c. What would you expect the effect on the TCA intermediates for a patientsuffering from vitamin B 2 /B 3 deficiency?arrow_forwardDraw the Krebs Cycle and show the entry points for the amino acids Alanine,Glutamic Acid, Asparagine, and Valine into the Krebs Cycle - (Draw the Mechanism). How many rounds of Krebs will be required to waste all Carbons of Glutamic Acidas CO2?arrow_forward
 Human Biology (MindTap Course List)BiologyISBN:9781305112100Author:Cecie Starr, Beverly McMillanPublisher:Cengage Learning
 Biology (MindTap Course List)BiologyISBN:9781337392938Author:Eldra Solomon, Charles Martin, Diana W. Martin, Linda R. BergPublisher:Cengage Learning