A Problem Solving Approach to Mathematics for Elementary School Teachers, Books a la Carte Edition plus NEW MyLab Math with Pearson eText - Access Card Package (12th Edition)
12th Edition
ISBN: 9780133865479
Author: Rick Billstein, Shlomo Libeskind, Johnny Lott
Publisher: PEARSON
expand_more
expand_more
format_list_bulleted
Videos
Textbook Question
Chapter 10.3B, Problem 4A
The graph depicts the spelling result from Mr. DiMaso’s class.
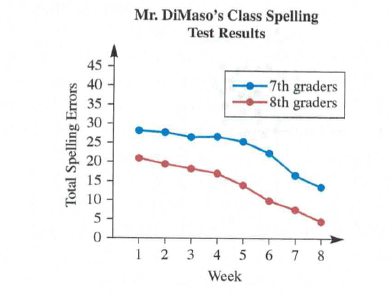
a. Describe any trends you observe.
b. What conclusions might you draw about Mr. DiMaso’s teaching program?
c. Make a predict as to the total number of spelling errors the
Expert Solution & Answer
Want to see the full answer?
Check out a sample textbook solution
Students have asked these similar questions
Stella's friends got her a skydiving lesson for her birthday. Her helicopter took
off from the skydiving center, ascending in an angle of 37°, and traveled a
distance of 2.1 kilometers before she fell in a straight line perpendicular to the
ground.
How far from the skydiving center did Stella land?
Be sure to have all three parts of a CER answer: make a claim, provide
evidence, and explain your reasoning for full credit.
2.1 km
Landing spot
37% Skydiving center
Solve please thanks!
Solve please and thank you
Chapter 10 Solutions
A Problem Solving Approach to Mathematics for Elementary School Teachers, Books a la Carte Edition plus NEW MyLab Math with Pearson eText - Access Card Package (12th Edition)
Ch. 10.1 - Read about basic ideas of statistics in Common...Ch. 10.1 - Suggest how students at different grades might...Ch. 10.1 - Examine grade-school books to see what types of...Ch. 10.1 - Mathematical Connections What are the Nielsen...Ch. 10.1 - Prob. 7MCCh. 10.1 - National Assessment of Educational ProgressNAEP...Ch. 10.1 - Prob. 2NAEPCh. 10.1A - A second-grade class has a project to determine...Ch. 10.1A - Prob. 2ACh. 10.1A - Prob. 3A
Ch. 10.1A - To determine the most popular book among students...Ch. 10.1A - Prob. 5ACh. 10.1A - Prob. 6ACh. 10.1A - If a class were to investigate how many countries...Ch. 10.1A - Prob. 8ACh. 10.1A - In a set of student evaluations of their...Ch. 10.1A - Prob. 10ACh. 10.1A - If a bar graph like the one shown here were used...Ch. 10.1A - Prob. 12ACh. 10.1B - A second-grade class has a project to determine...Ch. 10.1B - An elementary school class decides to determine...Ch. 10.1B - Assessment To determine student computer use,...Ch. 10.1B - Prob. 7ACh. 10.1B - Prob. 8ACh. 10.1B - Assessment A university professor used a rating...Ch. 10.1B - Suppose a poll is to be conducted in an elementary...Ch. 10.1B - Prob. 11ACh. 10.1B - Determine the population and the sample in the...Ch. 10.2 - Mathematical Connections a. Discuss when a...Ch. 10.2 - Mathematical Connections Explain whether a circle...Ch. 10.2 - Mathematical Connections Explain why the sum of...Ch. 10.2 - Mathematical Connections The federal budget for...Ch. 10.2 - Prob. 5MCCh. 10.2 - Prob. 6MCCh. 10.2 - Mathematical Connections Find five examples of...Ch. 10.2 - Mathematical Connections A graph similar to the...Ch. 10.2 - Prob. 11MCCh. 10.2 - Prob. 12MCCh. 10.2 - Prob. 13MCCh. 10.2 - Prob. 14MCCh. 10.2 - Mathematical Connections Paul asks how to create a...Ch. 10.2 - National Assessment of Educational Progress NAEP...Ch. 10.2 - Prob. 2NAEPCh. 10.2 - National Assessment of Educational Progress NAEP...Ch. 10.2A - The following the pictograph shows the approximate...Ch. 10.2A - Prob. 2ACh. 10.2A - Sixth grade students reported the numbers of apps...Ch. 10.2A - Prob. 4ACh. 10.2A - Draw a histogram based on the stem and leaf plot...Ch. 10.2A - Prob. 6ACh. 10.2A - Prob. 7ACh. 10.2A - Prob. 8ACh. 10.2A - Prob. 9ACh. 10.2A - Prob. 10ACh. 10.2A - Seniors Sierra High were asked to about their...Ch. 10.2A - Prob. 12ACh. 10.2A - a. A 2-inch-long rectangle serves as a percentage...Ch. 10.2A - Prob. 14ACh. 10.2A - a. If the number of people reading mysteries in...Ch. 10.2A - Prob. 16ACh. 10.2A - Prob. 17ACh. 10.2A - Prob. 18ACh. 10.2A - Prob. 19ACh. 10.2B - The following pictograph shows the approximate...Ch. 10.2B - Display the following information about the status...Ch. 10.2B - Prob. 3ACh. 10.2B - The heights reached by 15 model rockets launched...Ch. 10.2B - Prob. 5ACh. 10.2B - Prob. 6ACh. 10.2B - Given the following bar graph, estimate the length...Ch. 10.2B - Prob. 8ACh. 10.2B - Prob. 9ACh. 10.2B - Prob. 10ACh. 10.2B - Draw a circle graph for the data in exercise 10....Ch. 10.2B - Use the circle graph to answer the following...Ch. 10.2B - a. In a circle graph, a sector containing 82...Ch. 10.2B - Prob. 14ACh. 10.2B - A list of presidents, with the number of children...Ch. 10.2B - Prob. 16ACh. 10.2B - The histogram below shows the number of books read...Ch. 10.3 - Explain the concept of association as it is...Ch. 10.3 - Jacquie argued that scatterplots had little value...Ch. 10.3 - The Smith family drew a circle graph of their...Ch. 10.3 - Prob. 9MCCh. 10.3 - Prob. 10MCCh. 10.3 - Prob. 1NAEPCh. 10.3A - Assessment The graph below shows the population of...Ch. 10.3A - Prob. 3ACh. 10.3A - Prob. 4ACh. 10.3A - Prob. 5ACh. 10.3A - Prob. 6ACh. 10.3A - Assessment Consider an arithmetic sequence with...Ch. 10.3A - Prob. 8ACh. 10.3A - Assessment In the following scatterplots, find an...Ch. 10.3A - The following data show the cost of various...Ch. 10.3A - Assessment If a trend line has equation...Ch. 10.3A - Assessment If a trend line has equation y=150.8x,...Ch. 10.3B - The graph below shows the average age at which...Ch. 10.3B - Answer the following questions based on the line...Ch. 10.3B - The graph below shows line graphs for...Ch. 10.3B - The graph depicts the spelling result from Mr....Ch. 10.3B - Prob. 5ACh. 10.3B - Prob. 6ACh. 10.3B - Prob. 7ACh. 10.3B - Use the scatterplots shown to answer the...Ch. 10.3B - In the following scatterplots, find an equation of...Ch. 10.3B - Prob. 10ACh. 10.3B - Prob. 11ACh. 10.3B - Prob. 12ACh. 10.3B - Assessment If a trend line has equation...Ch. 10.3B - For each of the following pairs of variables,...Ch. 10.4 - Carl had scores of 90,95,85, and 90 on his first...Ch. 10.4 - The mean of the five numbers given is 50: 20 35 50...Ch. 10.4 - Sue drives 5 mi at 30 mph and ten 5 mi at 50 mph....Ch. 10.4 - Mathematical Connections Explain why the mode...Ch. 10.4 - Prob. 9MCCh. 10.4 - Mathematical Connections The mean of 5,7,9 is 7....Ch. 10.4 - Prob. 11MCCh. 10.4 - Mathematical Connections What does a large...Ch. 10.4 - Mathematical Connections In each pair of variables...Ch. 10.4 - Prob. 14MCCh. 10.4 - Mathematical Connections A student asks, If the...Ch. 10.4 - Mathematical Connections Jose asks, Why can a...Ch. 10.4 - Mathematical Connections Suppose the class takes a...Ch. 10.4 - Mathematical Connections A student asks if it is...Ch. 10.4 - Prob. 21MCCh. 10.4 - Mathematical Connections A student asks if it is...Ch. 10.4 - Mathematical Connections Mels mean on 10 tests for...Ch. 10.4 - Prob. 24MCCh. 10.4 - Mathematical Connections Given the bar graph...Ch. 10.4 - Mathematical Connections Following are raw test...Ch. 10.4 - National Assessment of Educational Progress NAEP...Ch. 10.4 - National Assessment of Educational Progress NAEP...Ch. 10.4 - Prob. 3NAEPCh. 10.4A - Assessment Calculate the mean, the median, and the...Ch. 10.4A - Prob. 2ACh. 10.4A - Assessment a. If three students scored 75 on a...Ch. 10.4A - Prob. 4ACh. 10.4A - Assessment Suppose in Selinas class there were...Ch. 10.4A - Prob. 6ACh. 10.4A - Prob. 7ACh. 10.4A - Prob. 8ACh. 10.4A - Prob. 9ACh. 10.4A - Prob. 10ACh. 10.4A - Prob. 11ACh. 10.4A - Prob. 12ACh. 10.4A - Prob. 13ACh. 10.4A - Prob. 14ACh. 10.4A - Assessment Following are box plots comparing the...Ch. 10.4A - Prob. 16ACh. 10.4A - Prob. 17ACh. 10.4A - Assessment What is the standard deviation of the...Ch. 10.4A - Prob. 19ACh. 10.4A - Prob. 20ACh. 10.4A - Assume a normal distribution and that the average...Ch. 10.4A - Prob. 22ACh. 10.4A - Prob. 23ACh. 10.4A - Prob. 24ACh. 10.4A - Prob. 25ACh. 10.4A - Prob. 26ACh. 10.4A - Prob. 27ACh. 10.4B - Calculate the mean, the median, and the mode for...Ch. 10.4B - Prob. 2ACh. 10.4B - Prob. 3ACh. 10.4B - Prob. 4ACh. 10.4B - Prob. 5ACh. 10.4B - Prob. 6ACh. 10.4B - a. Mr. Alberto wanted to count the score on a term...Ch. 10.4B - Prob. 9ACh. 10.4B - Prob. 10ACh. 10.4B - Prob. 11ACh. 10.4B - Prob. 12ACh. 10.4B - Prob. 13ACh. 10.4B - Ginnys median score on three tests was 90. Her...Ch. 10.4B - Prob. 15ACh. 10.4B - Prob. 16ACh. 10.4B - a. If all the numbers in a set are equal, what is...Ch. 10.4B - In a school system, teachers start at a salary of...Ch. 10.4B - Prob. 20ACh. 10.4B - Prob. 21ACh. 10.4B - Prob. 22ACh. 10.4B - The weights of newborn babies in a certain country...Ch. 10.4B - Prob. 24ACh. 10.4B - Prob. 25ACh. 10.4B - Prob. 26ACh. 10.4B - Prob. 27ACh. 10.5 - Discuss the effect on the appearance of a graph...Ch. 10.5 - Words such as may as in may help with reading...Ch. 10.5 - Prob. 3MCCh. 10.5 - Prob. 4MCCh. 10.5 - Prob. 5MCCh. 10.5 - Prob. 6MCCh. 10.5 - Following are the record swimming times of the...Ch. 10.5 - National Assessment of Educational Progress NAEP...Ch. 10.5 - Richard wants to estimate the average mean monthly...Ch. 10.5 - Prob. 3NAEPCh. 10.5A - Assessment The city of Podunk advertised itself as...Ch. 10.5A - Prob. 3ACh. 10.5A - Prob. 4ACh. 10.5A - Prob. 5ACh. 10.5A - Mathematical Connections Refer to the following...Ch. 10.5A - Prob. 9ACh. 10.5A - Prob. 10ACh. 10.5A - Prob. 11ACh. 10.5A - Prob. 12ACh. 10.5A - Prob. 14ACh. 10.5A - Prob. 15ACh. 10.5A - Prob. 16ACh. 10.5B - Prob. 4ACh. 10.5B - Prob. 10ACh. 10.5B - Prob. 11ACh. 10.5B - Prob. 12ACh. 10.5B - Prob. 13ACh. 10.5B - Prob. 14ACh. 10.5B - What are the characteristics that you think a...Ch. 10.5B - Prob. 16ACh. 10.5B - Prob. 17ACh. 10.5B - Prob. 18ACh. 10.5B - In the figure shown, monthly sales of three...Ch. 10.5B - Prob. 20ACh. 10.CR - Suppose you read that the average family in...Ch. 10.CR - Prob. 2CRCh. 10.CR - Prob. 3CRCh. 10.CR - Prob. 5CRCh. 10.CR - Prob. 6CRCh. 10.CR - The budget for the Wegetem Crime Co. is 2,000,000....Ch. 10.CR - Prob. 8CRCh. 10.CR - Prob. 9CRCh. 10.CR - Prob. 10CRCh. 10.CR - The life expectancies at birth for males and...Ch. 10.CR - Prob. 12CRCh. 10.CR - Prob. 13CRCh. 10.CR - Prob. 14CRCh. 10.CR - Prob. 15CRCh. 10.CR - Prob. 16CRCh. 10.CR - Prob. 17CRCh. 10.CR - Prob. 18CRCh. 10.CR - Prob. 20CRCh. 10.CR - Prob. 21CRCh. 10.CR - Prob. 22CRCh. 10.CR - Prob. 23CRCh. 10.CR - Prob. 24CRCh. 10.CR - Prob. 26CRCh. 10.CR - CHAPTER 10 REVIEW Give examples of several ways to...Ch. 10.CR - Prob. 28CRCh. 10.CR - Prob. 29CRCh. 10.CR - Prob. 30CRCh. 10.CR - Prob. 31CRCh. 10.CR - Prob. 32CRCh. 10 - NOW TRY THIS On the student page shown below, work...Ch. 10 - Prob. 2NTCh. 10 - Prob. 3NTCh. 10 - Prob. 4NTCh. 10 - Prob. 5NTCh. 10 - Prob. 7NTCh. 10 - Prob. 8NTCh. 10 - Prob. 9NTCh. 10 - Prob. 10NTCh. 10 - Prob. 12NTCh. 10 - Prob. 13NT
Knowledge Booster


Learn more about
Need a deep-dive on the concept behind this application? Look no further. Learn more about this topic, subject and related others by exploring similar questions and additional content below.Similar questions
- According to Newton's law of universal gravitation, the force F between two bodies of constant mass GmM m and M is given by the formula F = , where G is the gravitational constant and d is the d² distance between the bodies. a. Suppose that G, m, and M are constants. Find the rate of change of force F with respect to distance d. F' (d) 2GmM b. Find the rate of change of force F with gravitational constant G = 6.67 × 10-¹¹ Nm²/kg², on two bodies 5 meters apart, each with a mass of 250 kilograms. Answer in scientific notation, rounding to 2 decimal places. -6.67x10 N/m syntax incomplete.arrow_forwardSolve please and thank youarrow_forwardA major company in the Montreal area, offering a range of engineering services from project preparation to construction execution, and industrial project management, wants to ensure that the individuals who are responsible for project cost estimation and bid preparation demonstrate a certain uniformity in their estimates. The head of civil engineering and municipal services decided to structure an experimental plan to detect if there could be significant differences in project evaluation. Seven projects were selected, each of which had to be evaluated by each of the two estimators, with the order of the projects submitted being random. The obtained estimates are presented in the table below. a) Complete the table above by calculating: i. The differences (A-B) ii. The sum of the differences iii. The mean of the differences iv. The standard deviation of the differences b) What is the value of the t-statistic? c) What is the critical t-value for this test at a significance level of 1%?…arrow_forward
- In the graph provided, triangle N'O'P' is the image of triangle NOP after a dilation. 104 -9- -8- 7 6 N 5 0 -4- N 3 2 1 -10 -9 -8 -7 -6 -5 -4 -3 -2 -1 1 2 3 4 5 6 7 8 9 10 -1 -2 -3 -4 p -5 -6 -7 -8 Xarrow_forwardmv2 The centripetal force of an object of mass m is given by F (r) = rotation and r is the distance from the center of rotation. ' where v is the speed of r a. Find the rate of change of centripetal force with respect to the distance from the center of rotation. F(r) b. Find the rate of change of centripetal force of an object with mass 500 kilograms, velocity of 13.86 m/s, and a distance from the center of rotation of 300 meters. Round to 2 decimal places. N/m (or kg/s²) F' (300)arrow_forward104 8 6 4 G G 2 F -10 -8 -6 -4 -2 0 2 4 6 8 10 N H -4 H 6 8 10arrow_forward
- The coordinates of AABC are shown on the coordinate plane provided. AABC is dilated from the origin by scale factor r=2. 2 3 -2 0 1 2 2 m 17arrow_forwardIn the diagram provided, AABC-AAPQ. Read each statement and then arrange the true/false statements in order. B P A Carrow_forwardCompute the relative risk of falling for the two groups (did not stop walking vs. did stop). State/interpret your result verbally.arrow_forward
- not use ai pleasearrow_forwardlearn.edgenuity : C&C VIP Unit Test Unit Test Review Active 1 2 3 4 Which statement is true about the graph of the equation y = csc¯¹(x)? There is a horizontal asymptote at y = 0. उद There is a horizontal asymptote at y = 2. There is a vertical asymptote at x = 0. O There is a vertical asymptote at x=- R Mark this and return C Save and Exit emiarrow_forwardPlease helparrow_forward
arrow_back_ios
SEE MORE QUESTIONS
arrow_forward_ios
Recommended textbooks for you
 Glencoe Algebra 1, Student Edition, 9780079039897...AlgebraISBN:9780079039897Author:CarterPublisher:McGraw Hill
 Holt Mcdougal Larson Pre-algebra: Student Edition...AlgebraISBN:9780547587776Author:HOLT MCDOUGALPublisher:HOLT MCDOUGAL
 Functions and Change: A Modeling Approach to Coll...AlgebraISBN:9781337111348Author:Bruce Crauder, Benny Evans, Alan NoellPublisher:Cengage Learning
 Big Ideas Math A Bridge To Success Algebra 1: Stu...AlgebraISBN:9781680331141Author:HOUGHTON MIFFLIN HARCOURTPublisher:Houghton Mifflin Harcourt
Glencoe Algebra 1, Student Edition, 9780079039897...
Algebra
ISBN:9780079039897
Author:Carter
Publisher:McGraw Hill
Holt Mcdougal Larson Pre-algebra: Student Edition...
Algebra
ISBN:9780547587776
Author:HOLT MCDOUGAL
Publisher:HOLT MCDOUGAL
Functions and Change: A Modeling Approach to Coll...
Algebra
ISBN:9781337111348
Author:Bruce Crauder, Benny Evans, Alan Noell
Publisher:Cengage Learning
Big Ideas Math A Bridge To Success Algebra 1: Stu...
Algebra
ISBN:9781680331141
Author:HOUGHTON MIFFLIN HARCOURT
Publisher:Houghton Mifflin Harcourt
Graph Theory: Euler Paths and Euler Circuits; Author: Mathispower4u;https://www.youtube.com/watch?v=5M-m62qTR-s;License: Standard YouTube License, CC-BY
WALK,TRIAL,CIRCUIT,PATH,CYCLE IN GRAPH THEORY; Author: DIVVELA SRINIVASA RAO;https://www.youtube.com/watch?v=iYVltZtnAik;License: Standard YouTube License, CC-BY