
Elementary Statistics 2nd Edition
2nd Edition
ISBN: 9781259724275
Author: William Navidi, Barry Monk
Publisher: McGraw-Hill Education
expand_more
expand_more
format_list_bulleted
Videos
Textbook Question
Chapter 10.3, Problem 10E
Truck pollution: In an experiment to determine the effect of ambient temperature on the missions of oxides of nitrogen (NOX) of diesel trucks, 10 trucks were run at temperatures of 40F and 80F. The emissions, m parts per billion, are presented in the following table.
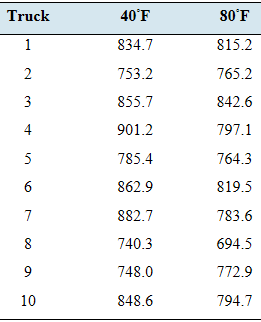
- Construct a 99% confidence interval for the difference in
mean emissions between trucks running at 40F and trucks running at 80F. - Based on the confidence Interval, is it reasonable to believe that the mean emissions at 40F may be the same as the mean at 80F?
Expert Solution & Answer
Want to see the full answer?
Check out a sample textbook solution
Students have asked these similar questions
In a company with 80 employees, 60 earn $10.00 per hour and 20 earn $13.00 per
hour.
Is this average hourly wage considered representative?
The following is a list of questions answered correctly on an exam. Calculate the
Measures of Central Tendency from the ungrouped data list.
NUMBER OF QUESTIONS ANSWERED CORRECTLY ON AN APTITUDE EXAM
112
72
69
97
107
73
92
76
86
73
126
128
118
127
124
82
104
132
134
83
92
108
96
100
92
115
76
91
102
81
95
141
81
80
106
84
119
113
98
75
68
98
115
106
95
100
85
94
106
119
The following ordered data list shows the data speeds for cell phones used by a
telephone company at an airport:
A. Calculate the Measures of Central Tendency using the table in point B.
B. Are there differences in the measurements obtained in A and C? Why (give at
least one justified reason)?
0.8
1.4
1.8
1.9
3.2
3.6
4.5
4.5
4.6
6.2
6.5
7.7
7.9
9.9
10.2
10.3
10.9
11.1
11.1
11.6
11.8
12.0
13.1
13.5
13.7
14.1
14.2
14.7
15.0
15.1
15.5
15.8
16.0
17.5
18.2
20.2
21.1
21.5
22.2
22.4
23.1
24.5
25.7
28.5
34.6
38.5
43.0
55.6
71.3
77.8
Chapter 10 Solutions
Elementary Statistics 2nd Edition
Ch. 10.1 - In Exercises 5 and 6, fill in each blank with e...Ch. 10.1 - In Exercises 5 and 6, fill in each blank with e...Ch. 10.1 - Prob. 7ECh. 10.1 - Prob. 8ECh. 10.1 - In Exercises 9-14, construct the confidence...Ch. 10.1 - Prob. 10ECh. 10.1 - In Exercises 9-14, construct the confidence...Ch. 10.1 - Prob. 12ECh. 10.1 - Prob. 13ECh. 10.1 - Prob. 14E
Ch. 10.1 - Does this diet help? A group of 78 people enrolled...Ch. 10.1 - Contaminated water: The concentration of benzene...Ch. 10.1 - Fertilizer: In an agricultural experiment, the...Ch. 10.1 - Computer crashes: A computer system administrator...Ch. 10.1 - Are you smarter than your older brother? In a...Ch. 10.1 - Effectiveness of distance learning: A study was...Ch. 10.1 - Boys and girls: The National Health Statistics...Ch. 10.1 - Body mass index: In a survey of adults with...Ch. 10.1 - Energy drinks: A survey of college students...Ch. 10.1 - Low-fat or low-carb? Are low-fat diets or low-carb...Ch. 10.1 - Online testing: Do you prefer taking tests on...Ch. 10.1 - Drive safely: How often does the average driver...Ch. 10.1 - Interpret calculator display: The following TI-84...Ch. 10.1 - Prob. 28ECh. 10.1 - Prob. 29ECh. 10.1 - Prob. 30ECh. 10.1 - Prob. 31ECh. 10.2 - In Exercises 3 and 4, fill in each blank with the...Ch. 10.2 - Prob. 4ECh. 10.2 - Prob. 5ECh. 10.2 - Prob. 6ECh. 10.2 - In Exercises 7-12, construct the confidence...Ch. 10.2 - In Exercises 7-12, construct the confidence...Ch. 10.2 - In Exercises 7-12, construct the confidence...Ch. 10.2 - In Exercises 7-12, construct the confidence...Ch. 10.2 - In Exercises 7-12, construct the confidence...Ch. 10.2 - Prob. 12ECh. 10.2 - Traffic accidents: Traffic engineers compared...Ch. 10.2 - Computers in the classroom: In a new experimental...Ch. 10.2 - Pain after surgery: In a random sample of 50...Ch. 10.2 - Pretzels: In order to judge the effectiveness of...Ch. 10.2 - Defective electronics: A team of designers was...Ch. 10.2 - Prob. 18ECh. 10.2 - Cancer prevention: Colonoscopy is a medical...Ch. 10.2 - Social media: A Pew poll found that in a sample of...Ch. 10.2 - Interpret calculator display: The following TI-84...Ch. 10.2 - Prob. 22ECh. 10.2 - Prob. 23ECh. 10.2 - Prob. 24ECh. 10.2 - Finding the sample size: Polls are to be conducted...Ch. 10.3 - In Exercises 3 and 4, fill in each blank with the...Ch. 10.3 - Prob. 4ECh. 10.3 - Prob. 5ECh. 10.3 - In Exercises 5 and 6, determine whether the...Ch. 10.3 - Fast computer: microprocessors are compared on a...Ch. 10.3 - Brake wear: For a sample of 9 automobiles, the...Ch. 10.3 - Strength of concrete: The compressive strength, m...Ch. 10.3 - Truck pollution: In an experiment to determine the...Ch. 10.3 - High cholesterol: A group of eight individuals...Ch. 10.3 - Tires and fuel economy: A tire manufacturer is...Ch. 10.3 - Prob. 13ECh. 10.3 - Prob. 14ECh. 10.3 - Interpret calculator display: The following TI-84...Ch. 10.3 - Interpret calculator display: The following TI-84...Ch. 10.3 - Prob. 17ECh. 10.3 - Prob. 18ECh. 10.3 - Advantage of matched pairs: Refer to Exercise 12....Ch. 10.3 - Paired or independent? To construct a confidence...Ch. 10 - In Exercises 1 and 2, determine whether the...Ch. 10 - Prob. 2CQCh. 10 - Prob. 3CQCh. 10 - Prob. 4CQCh. 10 - Prob. 5CQCh. 10 - Prob. 6CQCh. 10 - Prob. 7CQCh. 10 - Prob. 8CQCh. 10 - Prob. 9CQCh. 10 - Prob. 10CQCh. 10 - Prob. 11CQCh. 10 - Refer to Exercise 11. Find the critical value for...Ch. 10 - Prob. 13CQCh. 10 - Prob. 14CQCh. 10 - Prob. 15CQCh. 10 - Prob. 1RECh. 10 - Prob. 2RECh. 10 - Prob. 3RECh. 10 - Prob. 4RECh. 10 - Prob. 5RECh. 10 - Prob. 6RECh. 10 - Prob. 7RECh. 10 - Prob. 8RECh. 10 - Prob. 9RECh. 10 - Prob. 10RECh. 10 - Prob. 11RECh. 10 - Prob. 12RECh. 10 - Prob. 13RECh. 10 - Prob. 14RECh. 10 - Prob. 15RECh. 10 - Prob. 1WAICh. 10 - Prob. 2WAICh. 10 - Prob. 3WAICh. 10 - Prob. 4WAICh. 10 - Prob. 1CSCh. 10 - Prob. 2CSCh. 10 - Prob. 3CS
Knowledge Booster


Learn more about
Need a deep-dive on the concept behind this application? Look no further. Learn more about this topic, statistics and related others by exploring similar questions and additional content below.Similar questions
- In a company with 80 employees, 60 earn $10.00 per hour and 20 earn $13.00 per hour. a) Determine the average hourly wage. b) In part a), is the same answer obtained if the 60 employees have an average wage of $10.00 per hour? Prove your answer.arrow_forwardThe following ordered data list shows the data speeds for cell phones used by a telephone company at an airport: A. Calculate the Measures of Central Tendency from the ungrouped data list. B. Group the data in an appropriate frequency table. 0.8 1.4 1.8 1.9 3.2 3.6 4.5 4.5 4.6 6.2 6.5 7.7 7.9 9.9 10.2 10.3 10.9 11.1 11.1 11.6 11.8 12.0 13.1 13.5 13.7 14.1 14.2 14.7 15.0 15.1 15.5 15.8 16.0 17.5 18.2 20.2 21.1 21.5 22.2 22.4 23.1 24.5 25.7 28.5 34.6 38.5 43.0 55.6 71.3 77.8arrow_forwardBusinessarrow_forward
- https://www.hawkeslearning.com/Statistics/dbs2/datasets.htmlarrow_forwardNC Current Students - North Ce X | NC Canvas Login Links - North ( X Final Exam Comprehensive x Cengage Learning x WASTAT - Final Exam - STAT → C webassign.net/web/Student/Assignment-Responses/submit?dep=36055360&tags=autosave#question3659890_9 Part (b) Draw a scatter plot of the ordered pairs. N Life Expectancy Life Expectancy 80 70 600 50 40 30 20 10 Year of 1950 1970 1990 2010 Birth O Life Expectancy Part (c) 800 70 60 50 40 30 20 10 1950 1970 1990 W ALT 林 $ # 4 R J7 Year of 2010 Birth F6 4+ 80 70 60 50 40 30 20 10 Year of 1950 1970 1990 2010 Birth Life Expectancy Ox 800 70 60 50 40 30 20 10 Year of 1950 1970 1990 2010 Birth hp P.B. KA & 7 80 % 5 H A B F10 711 N M K 744 PRT SC ALT CTRLarrow_forwardHarvard University California Institute of Technology Massachusetts Institute of Technology Stanford University Princeton University University of Cambridge University of Oxford University of California, Berkeley Imperial College London Yale University University of California, Los Angeles University of Chicago Johns Hopkins University Cornell University ETH Zurich University of Michigan University of Toronto Columbia University University of Pennsylvania Carnegie Mellon University University of Hong Kong University College London University of Washington Duke University Northwestern University University of Tokyo Georgia Institute of Technology Pohang University of Science and Technology University of California, Santa Barbara University of British Columbia University of North Carolina at Chapel Hill University of California, San Diego University of Illinois at Urbana-Champaign National University of Singapore McGill…arrow_forward
- Name Harvard University California Institute of Technology Massachusetts Institute of Technology Stanford University Princeton University University of Cambridge University of Oxford University of California, Berkeley Imperial College London Yale University University of California, Los Angeles University of Chicago Johns Hopkins University Cornell University ETH Zurich University of Michigan University of Toronto Columbia University University of Pennsylvania Carnegie Mellon University University of Hong Kong University College London University of Washington Duke University Northwestern University University of Tokyo Georgia Institute of Technology Pohang University of Science and Technology University of California, Santa Barbara University of British Columbia University of North Carolina at Chapel Hill University of California, San Diego University of Illinois at Urbana-Champaign National University of Singapore…arrow_forwardA company found that the daily sales revenue of its flagship product follows a normal distribution with a mean of $4500 and a standard deviation of $450. The company defines a "high-sales day" that is, any day with sales exceeding $4800. please provide a step by step on how to get the answers in excel Q: What percentage of days can the company expect to have "high-sales days" or sales greater than $4800? Q: What is the sales revenue threshold for the bottom 10% of days? (please note that 10% refers to the probability/area under bell curve towards the lower tail of bell curve) Provide answers in the yellow cellsarrow_forwardFind the critical value for a left-tailed test using the F distribution with a 0.025, degrees of freedom in the numerator=12, and degrees of freedom in the denominator = 50. A portion of the table of critical values of the F-distribution is provided. Click the icon to view the partial table of critical values of the F-distribution. What is the critical value? (Round to two decimal places as needed.)arrow_forward
- A retail store manager claims that the average daily sales of the store are $1,500. You aim to test whether the actual average daily sales differ significantly from this claimed value. You can provide your answer by inserting a text box and the answer must include: Null hypothesis, Alternative hypothesis, Show answer (output table/summary table), and Conclusion based on the P value. Showing the calculation is a must. If calculation is missing,so please provide a step by step on the answers Numerical answers in the yellow cellsarrow_forwardShow all workarrow_forwardShow all workarrow_forward
arrow_back_ios
SEE MORE QUESTIONS
arrow_forward_ios
Recommended textbooks for you
 Glencoe Algebra 1, Student Edition, 9780079039897...AlgebraISBN:9780079039897Author:CarterPublisher:McGraw Hill
 Big Ideas Math A Bridge To Success Algebra 1: Stu...AlgebraISBN:9781680331141Author:HOUGHTON MIFFLIN HARCOURTPublisher:Houghton Mifflin Harcourt
 Linear Algebra: A Modern IntroductionAlgebraISBN:9781285463247Author:David PoolePublisher:Cengage Learning
Glencoe Algebra 1, Student Edition, 9780079039897...
Algebra
ISBN:9780079039897
Author:Carter
Publisher:McGraw Hill
Big Ideas Math A Bridge To Success Algebra 1: Stu...
Algebra
ISBN:9781680331141
Author:HOUGHTON MIFFLIN HARCOURT
Publisher:Houghton Mifflin Harcourt
Linear Algebra: A Modern Introduction
Algebra
ISBN:9781285463247
Author:David Poole
Publisher:Cengage Learning
Hypothesis Testing using Confidence Interval Approach; Author: BUM2413 Applied Statistics UMP;https://www.youtube.com/watch?v=Hq1l3e9pLyY;License: Standard YouTube License, CC-BY
Hypothesis Testing - Difference of Two Means - Student's -Distribution & Normal Distribution; Author: The Organic Chemistry Tutor;https://www.youtube.com/watch?v=UcZwyzwWU7o;License: Standard Youtube License