
Elementary Statistics 2nd Edition
2nd Edition
ISBN: 9781259724275
Author: William Navidi, Barry Monk
Publisher: McGraw-Hill Education
expand_more
expand_more
format_list_bulleted
Videos
Textbook Question
Chapter 10.3, Problem 15E
Interpret calculator display: The following TI-84 Plus calculator display presents a 95% confidence interval for the
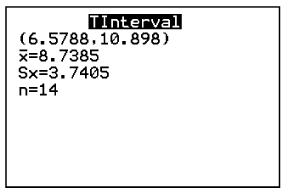
What is the point estimate of
How many degrees of freedom are there?
Fill in the blanks: We are 95% confident that the mean difference is between _____and______.
Expert Solution & Answer
Want to see the full answer?
Check out a sample textbook solution
Students have asked these similar questions
II Consider the following data matrix X:
X1
X2
0.5
0.4
0.2 0.5
0.5
0.5
10.3 10
10.1 10.4
10.1
10.5
What will the resulting clusters be when using the k-Means method with k = 2. In your own words, explain why this result is
indeed expected, i.e. why this clustering minimises the ESS map.
why the answer is 3 and 10?
PS
9 Two films are shown on screen A and screen B at a cinema each evening. The numbers
of people viewing the films on 12 consecutive evenings are shown in the back-to-back
stem-and-leaf diagram.
Screen A (12) Screen B (12)
8
037
34
7 6 4 0 534
74 1645678
92 71689
Key: 116|4 represents 61 viewers for A and 64 viewers for B
A second stem-and-leaf diagram (with rows of the same width as the previous diagram)
is drawn showing the total number of people viewing films at the cinema on each of
these 12 evenings. Find the least and greatest possible number of rows that this second
diagram could have.
TIP
On the evening when 30 people viewed films on screen A, there could have been as few
as 37 or as many as 79 people viewing films on screen B.
Chapter 10 Solutions
Elementary Statistics 2nd Edition
Ch. 10.1 - In Exercises 5 and 6, fill in each blank with e...Ch. 10.1 - In Exercises 5 and 6, fill in each blank with e...Ch. 10.1 - Prob. 7ECh. 10.1 - Prob. 8ECh. 10.1 - In Exercises 9-14, construct the confidence...Ch. 10.1 - Prob. 10ECh. 10.1 - In Exercises 9-14, construct the confidence...Ch. 10.1 - Prob. 12ECh. 10.1 - Prob. 13ECh. 10.1 - Prob. 14E
Ch. 10.1 - Does this diet help? A group of 78 people enrolled...Ch. 10.1 - Contaminated water: The concentration of benzene...Ch. 10.1 - Fertilizer: In an agricultural experiment, the...Ch. 10.1 - Computer crashes: A computer system administrator...Ch. 10.1 - Are you smarter than your older brother? In a...Ch. 10.1 - Effectiveness of distance learning: A study was...Ch. 10.1 - Boys and girls: The National Health Statistics...Ch. 10.1 - Body mass index: In a survey of adults with...Ch. 10.1 - Energy drinks: A survey of college students...Ch. 10.1 - Low-fat or low-carb? Are low-fat diets or low-carb...Ch. 10.1 - Online testing: Do you prefer taking tests on...Ch. 10.1 - Drive safely: How often does the average driver...Ch. 10.1 - Interpret calculator display: The following TI-84...Ch. 10.1 - Prob. 28ECh. 10.1 - Prob. 29ECh. 10.1 - Prob. 30ECh. 10.1 - Prob. 31ECh. 10.2 - In Exercises 3 and 4, fill in each blank with the...Ch. 10.2 - Prob. 4ECh. 10.2 - Prob. 5ECh. 10.2 - Prob. 6ECh. 10.2 - In Exercises 7-12, construct the confidence...Ch. 10.2 - In Exercises 7-12, construct the confidence...Ch. 10.2 - In Exercises 7-12, construct the confidence...Ch. 10.2 - In Exercises 7-12, construct the confidence...Ch. 10.2 - In Exercises 7-12, construct the confidence...Ch. 10.2 - Prob. 12ECh. 10.2 - Traffic accidents: Traffic engineers compared...Ch. 10.2 - Computers in the classroom: In a new experimental...Ch. 10.2 - Pain after surgery: In a random sample of 50...Ch. 10.2 - Pretzels: In order to judge the effectiveness of...Ch. 10.2 - Defective electronics: A team of designers was...Ch. 10.2 - Prob. 18ECh. 10.2 - Cancer prevention: Colonoscopy is a medical...Ch. 10.2 - Social media: A Pew poll found that in a sample of...Ch. 10.2 - Interpret calculator display: The following TI-84...Ch. 10.2 - Prob. 22ECh. 10.2 - Prob. 23ECh. 10.2 - Prob. 24ECh. 10.2 - Finding the sample size: Polls are to be conducted...Ch. 10.3 - In Exercises 3 and 4, fill in each blank with the...Ch. 10.3 - Prob. 4ECh. 10.3 - Prob. 5ECh. 10.3 - In Exercises 5 and 6, determine whether the...Ch. 10.3 - Fast computer: microprocessors are compared on a...Ch. 10.3 - Brake wear: For a sample of 9 automobiles, the...Ch. 10.3 - Strength of concrete: The compressive strength, m...Ch. 10.3 - Truck pollution: In an experiment to determine the...Ch. 10.3 - High cholesterol: A group of eight individuals...Ch. 10.3 - Tires and fuel economy: A tire manufacturer is...Ch. 10.3 - Prob. 13ECh. 10.3 - Prob. 14ECh. 10.3 - Interpret calculator display: The following TI-84...Ch. 10.3 - Interpret calculator display: The following TI-84...Ch. 10.3 - Prob. 17ECh. 10.3 - Prob. 18ECh. 10.3 - Advantage of matched pairs: Refer to Exercise 12....Ch. 10.3 - Paired or independent? To construct a confidence...Ch. 10 - In Exercises 1 and 2, determine whether the...Ch. 10 - Prob. 2CQCh. 10 - Prob. 3CQCh. 10 - Prob. 4CQCh. 10 - Prob. 5CQCh. 10 - Prob. 6CQCh. 10 - Prob. 7CQCh. 10 - Prob. 8CQCh. 10 - Prob. 9CQCh. 10 - Prob. 10CQCh. 10 - Prob. 11CQCh. 10 - Refer to Exercise 11. Find the critical value for...Ch. 10 - Prob. 13CQCh. 10 - Prob. 14CQCh. 10 - Prob. 15CQCh. 10 - Prob. 1RECh. 10 - Prob. 2RECh. 10 - Prob. 3RECh. 10 - Prob. 4RECh. 10 - Prob. 5RECh. 10 - Prob. 6RECh. 10 - Prob. 7RECh. 10 - Prob. 8RECh. 10 - Prob. 9RECh. 10 - Prob. 10RECh. 10 - Prob. 11RECh. 10 - Prob. 12RECh. 10 - Prob. 13RECh. 10 - Prob. 14RECh. 10 - Prob. 15RECh. 10 - Prob. 1WAICh. 10 - Prob. 2WAICh. 10 - Prob. 3WAICh. 10 - Prob. 4WAICh. 10 - Prob. 1CSCh. 10 - Prob. 2CSCh. 10 - Prob. 3CS
Knowledge Booster


Learn more about
Need a deep-dive on the concept behind this application? Look no further. Learn more about this topic, statistics and related others by exploring similar questions and additional content below.Similar questions
- Q.2.4 There are twelve (12) teams participating in a pub quiz. What is the probability of correctly predicting the top three teams at the end of the competition, in the correct order? Give your final answer as a fraction in its simplest form.arrow_forwardThe table below indicates the number of years of experience of a sample of employees who work on a particular production line and the corresponding number of units of a good that each employee produced last month. Years of Experience (x) Number of Goods (y) 11 63 5 57 1 48 4 54 5 45 3 51 Q.1.1 By completing the table below and then applying the relevant formulae, determine the line of best fit for this bivariate data set. Do NOT change the units for the variables. X y X2 xy Ex= Ey= EX2 EXY= Q.1.2 Estimate the number of units of the good that would have been produced last month by an employee with 8 years of experience. Q.1.3 Using your calculator, determine the coefficient of correlation for the data set. Interpret your answer. Q.1.4 Compute the coefficient of determination for the data set. Interpret your answer.arrow_forwardCan you answer this question for mearrow_forward
- Techniques QUAT6221 2025 PT B... TM Tabudi Maphoru Activities Assessments Class Progress lIE Library • Help v The table below shows the prices (R) and quantities (kg) of rice, meat and potatoes items bought during 2013 and 2014: 2013 2014 P1Qo PoQo Q1Po P1Q1 Price Ро Quantity Qo Price P1 Quantity Q1 Rice 7 80 6 70 480 560 490 420 Meat 30 50 35 60 1 750 1 500 1 800 2 100 Potatoes 3 100 3 100 300 300 300 300 TOTAL 40 230 44 230 2 530 2 360 2 590 2 820 Instructions: 1 Corall dawn to tha bottom of thir ceraan urina se se tha haca nariad in archerca antarand cubmit Q Search ENG US 口X 2025/05arrow_forwardThe table below indicates the number of years of experience of a sample of employees who work on a particular production line and the corresponding number of units of a good that each employee produced last month. Years of Experience (x) Number of Goods (y) 11 63 5 57 1 48 4 54 45 3 51 Q.1.1 By completing the table below and then applying the relevant formulae, determine the line of best fit for this bivariate data set. Do NOT change the units for the variables. X y X2 xy Ex= Ey= EX2 EXY= Q.1.2 Estimate the number of units of the good that would have been produced last month by an employee with 8 years of experience. Q.1.3 Using your calculator, determine the coefficient of correlation for the data set. Interpret your answer. Q.1.4 Compute the coefficient of determination for the data set. Interpret your answer.arrow_forwardQ.3.2 A sample of consumers was asked to name their favourite fruit. The results regarding the popularity of the different fruits are given in the following table. Type of Fruit Number of Consumers Banana 25 Apple 20 Orange 5 TOTAL 50 Draw a bar chart to graphically illustrate the results given in the table.arrow_forward
- Q.2.3 The probability that a randomly selected employee of Company Z is female is 0.75. The probability that an employee of the same company works in the Production department, given that the employee is female, is 0.25. What is the probability that a randomly selected employee of the company will be female and will work in the Production department? Q.2.4 There are twelve (12) teams participating in a pub quiz. What is the probability of correctly predicting the top three teams at the end of the competition, in the correct order? Give your final answer as a fraction in its simplest form.arrow_forwardQ.2.1 A bag contains 13 red and 9 green marbles. You are asked to select two (2) marbles from the bag. The first marble selected will not be placed back into the bag. Q.2.1.1 Construct a probability tree to indicate the various possible outcomes and their probabilities (as fractions). Q.2.1.2 What is the probability that the two selected marbles will be the same colour? Q.2.2 The following contingency table gives the results of a sample survey of South African male and female respondents with regard to their preferred brand of sports watch: PREFERRED BRAND OF SPORTS WATCH Samsung Apple Garmin TOTAL No. of Females 30 100 40 170 No. of Males 75 125 80 280 TOTAL 105 225 120 450 Q.2.2.1 What is the probability of randomly selecting a respondent from the sample who prefers Garmin? Q.2.2.2 What is the probability of randomly selecting a respondent from the sample who is not female? Q.2.2.3 What is the probability of randomly…arrow_forwardTest the claim that a student's pulse rate is different when taking a quiz than attending a regular class. The mean pulse rate difference is 2.7 with 10 students. Use a significance level of 0.005. Pulse rate difference(Quiz - Lecture) 2 -1 5 -8 1 20 15 -4 9 -12arrow_forward
- The following ordered data list shows the data speeds for cell phones used by a telephone company at an airport: A. Calculate the Measures of Central Tendency from the ungrouped data list. B. Group the data in an appropriate frequency table. C. Calculate the Measures of Central Tendency using the table in point B. D. Are there differences in the measurements obtained in A and C? Why (give at least one justified reason)? I leave the answers to A and B to resolve the remaining two. 0.8 1.4 1.8 1.9 3.2 3.6 4.5 4.5 4.6 6.2 6.5 7.7 7.9 9.9 10.2 10.3 10.9 11.1 11.1 11.6 11.8 12.0 13.1 13.5 13.7 14.1 14.2 14.7 15.0 15.1 15.5 15.8 16.0 17.5 18.2 20.2 21.1 21.5 22.2 22.4 23.1 24.5 25.7 28.5 34.6 38.5 43.0 55.6 71.3 77.8 A. Measures of Central Tendency We are to calculate: Mean, Median, Mode The data (already ordered) is: 0.8, 1.4, 1.8, 1.9, 3.2, 3.6, 4.5, 4.5, 4.6, 6.2, 6.5, 7.7, 7.9, 9.9, 10.2, 10.3, 10.9, 11.1, 11.1, 11.6, 11.8, 12.0, 13.1, 13.5, 13.7, 14.1, 14.2, 14.7, 15.0, 15.1, 15.5,…arrow_forwardPEER REPLY 1: Choose a classmate's Main Post. 1. Indicate a range of values for the independent variable (x) that is reasonable based on the data provided. 2. Explain what the predicted range of dependent values should be based on the range of independent values.arrow_forwardIn a company with 80 employees, 60 earn $10.00 per hour and 20 earn $13.00 per hour. Is this average hourly wage considered representative?arrow_forward
arrow_back_ios
SEE MORE QUESTIONS
arrow_forward_ios
Recommended textbooks for you
 Glencoe Algebra 1, Student Edition, 9780079039897...AlgebraISBN:9780079039897Author:CarterPublisher:McGraw Hill
 Big Ideas Math A Bridge To Success Algebra 1: Stu...AlgebraISBN:9781680331141Author:HOUGHTON MIFFLIN HARCOURTPublisher:Houghton Mifflin Harcourt
 Holt Mcdougal Larson Pre-algebra: Student Edition...AlgebraISBN:9780547587776Author:HOLT MCDOUGALPublisher:HOLT MCDOUGAL
Glencoe Algebra 1, Student Edition, 9780079039897...
Algebra
ISBN:9780079039897
Author:Carter
Publisher:McGraw Hill
Big Ideas Math A Bridge To Success Algebra 1: Stu...
Algebra
ISBN:9781680331141
Author:HOUGHTON MIFFLIN HARCOURT
Publisher:Houghton Mifflin Harcourt
Holt Mcdougal Larson Pre-algebra: Student Edition...
Algebra
ISBN:9780547587776
Author:HOLT MCDOUGAL
Publisher:HOLT MCDOUGAL
Hypothesis Testing using Confidence Interval Approach; Author: BUM2413 Applied Statistics UMP;https://www.youtube.com/watch?v=Hq1l3e9pLyY;License: Standard YouTube License, CC-BY
Hypothesis Testing - Difference of Two Means - Student's -Distribution & Normal Distribution; Author: The Organic Chemistry Tutor;https://www.youtube.com/watch?v=UcZwyzwWU7o;License: Standard Youtube License