For Problems 5–16, please provide the following information.
- (a) What is the level of significance? State the null and alternate hypotheses.
- (b) Find the value of the chi-square statistic for the sample. Are all the expected frequencies greater than 5? What sampling distribution will you use? What are the degrees of freedom?
- (c) Find or estimate the P-value of the sample test statistic.
- (d) Based on your answers in parts (a) to (c), will you reject or fail to reject the null hypothesis that the population fits the specified distribution of categories?
- (e) Interpret your conclusion in the context of the application.
Meteorology:

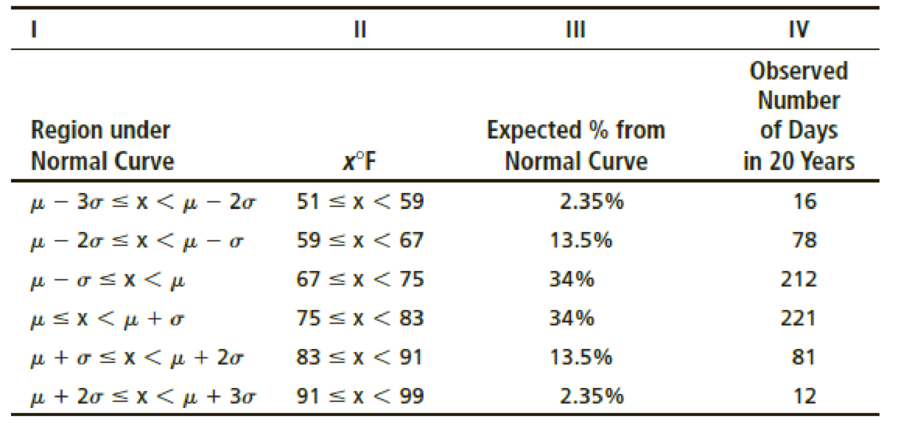
- (i) Remember that μ = 75 and σ = 8. Examine Figure 6-5 in Chapter 6. Write a brief explanation for Columns I, II, and III in the context of this problem.
- (ii) Use a 1% level of significance to test the claim that the average daily July temperature follows a normal distribution with μ = 75 and σ = 8.
Want to see the full answer?
Check out a sample textbook solution
Chapter 10 Solutions
Bundle: Understandable Statistics, Loose-leaf Version, 12th + WebAssign Printed Access Card for Brase/Brase's Understandable Statistics: Concepts and Methods, 12th Edition, Single-Term
- What is meant by the sample space of an experiment?arrow_forwardA random sample of 250 physicians shows that there are 40 of them who make at least $400,000 a year. What is the test statistic if we want to test that the true proportion of physicians in the population who make at least $400,000 a year is less than 0.20?arrow_forwardDr. Kijowski is concerned about student phone use, so she collects information on the number of text messages that each student sent on a particular day. The boxplot below shows the results. Based on the boxplot, which of the following is the most reasonable conclusion? a There are more people with data values below the median than there are people with data values above the median. b There are more people with data values between the first quartile and the median than there are people with data values between the median and the third quartile. c There are fewer people with data values between the first quartile and the median than there are people with data values between the median and the third quartile. d There are approximately the same number of people with data values between the first quartile and the minimum as there are people with data values between the third quartile and the maximum. e The data are less spread out between the first…arrow_forward
- Dr. Kijowski is concerned about student phone use, so she collects information on the number of text messages that each student sent on a particular day. The boxplot below shows the results. Based on the boxplot, which of the following is the most reasonable conclusion? a. There are more people with data values below the median than there are people with data values above the median. Selected:b. There are more people with data values between the first quartile and the median than there are people with data values between the median and the third quartile.This answer is incorrect. c. There are fewer people with data values between the first quartile and the median than there are people with data values between the median and the third quartile. d. There are approximately the same number of people with data values between the first quartile and the minimum as there are people with data values between the third quartile and the maximum. e. The data are less spread out between the…arrow_forwardPlease help me with this question (a through b).arrow_forwardI need help with questions 2 and 3arrow_forward
- A television sports commentator wants to estimate the proportion of citizens who "follow professional football." Complete parts (a) through (c). (a) What sample size should be obtained if he wants to be within 3 percentage points with 96% confidence if he uses an estimate of 48% obtained from a poll? (b) What sample size should be obtained if he wants to be within 3 percentage points with 96% confidence if he does not use any prior estimates? (c) Why are the results from parts (a) and (b) so close?arrow_forward. Suppose a researcher has heard that children watch an average of ten hours of TV per day. The researcher believes this is wrong but has no theory about whether it's an overestimate or an underestimate of the truth. If the researcher wants to do a z-test of one population mean, what will the researcher's alternative hypothesis be?arrow_forward(All one question just could not fit into one picture)arrow_forward
- What statistical tool should be used for this problem? 1. The Director of St. Michael's Medical Center wanted to find out the number of patients who were diagnosed with HIV in their hospital for the past three years. After then she grouped the data according to the different age group to determine which age group has more cases of HIV infection for the past three years.arrow_forwardIn studying the sampling distribution of the mean, you were asked to list all the different possible samples from a small population and then find the mean of each of them. Consider the following: Personal phone calls received in the last three days by a new employee were 2, 4, and 7. Assume that samples of size 2 are randomly selected with replacement from this population of three values. What different samples could be chosen? What would be their sample means?arrow_forwardHow do I input the following into Excel? You plan to conduct a survey to find what proportion of the workforce has two or more jobs. You decide on the 95% confidence interval and a margin of error of 2%. A pilot survey reveals that 5 of the 50 sampled hold two or more jobs. How many in the workforce should be interviewed to meet your requirements?arrow_forward
 Glencoe Algebra 1, Student Edition, 9780079039897...AlgebraISBN:9780079039897Author:CarterPublisher:McGraw Hill
 College Algebra (MindTap Course List)AlgebraISBN:9781305652231Author:R. David Gustafson, Jeff HughesPublisher:Cengage Learning

