
Elementary Statistics: A Step By Step Approach
10th Edition
ISBN: 9781259755330
Author: Allan G. Bluman
Publisher: McGraw-Hill Education
expand_more
expand_more
format_list_bulleted
Concept explainers
Videos
Textbook Question
Chapter 10, Problem 8CTC
Product Sales When the points in a
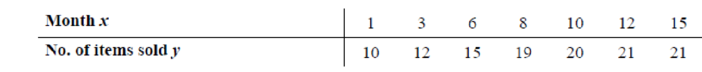
8. Compute r, using the x and y values; then compute r, using the log x and y values. Which is higher?
Expert Solution & Answer
Want to see the full answer?
Check out a sample textbook solution
Students have asked these similar questions
Elementary StatisticsBase on the same given data uploaded in module 4, will you conclude that the number of bathroom of houses is a significant factor for house sellprice? I your answer is affirmative, you need to explain how the number of bathroom influences the house price, using a post hoc procedure. (Please treat number of bathrooms as a categorical variable in this analysis)Base on the same given data, conduct an analysis for the variable sellprice to see if sale price is influenced by living area. Summarize your finding including all regular steps (learned in this module) for your method. Also, will you conclude that larger house corresponding to higher price (justify)?Each question need to include a spss or sas output.
Instructions:
You have to use SAS or SPSS to perform appropriate procedure: ANOVA or Regression based on the project data (provided in the module 4) and research question in the project file. Attach the computer output of all key steps (number) quoted in…
Elementary StatsBase on the given data uploaded in module 4, change the variable sale price into two categories: abovethe mean price or not; and change the living area into two categories: above the median living area ornot ( your two group should have close number of houses in each group). Using the resulting variables,will you conclude that larger house corresponding to higher price?Note: Need computer output, Ho and Ha, P and decision. If p is small, you need to explain what type ofdependency (association) we have using an appropriate pair of percentages.
Please include how to use the data in SPSS and interpretation of data.
An environmental research team is studying the daily rainfall (in millimeters) in a region over 100 days.
The data is grouped into the following histogram bins:
Rainfall Range (mm) Frequency
0-9.9
15
10 19.9
25
20-29.9
30
30-39.9
20
||40-49.9
10
a) If a random day is selected, what is the probability that the rainfall was at least 20 mm but less than 40
mm?
b) Estimate the mean daily rainfall, assuming the rainfall in each bin is uniformly distributed and the
midpoint of each bin represents the average rainfall for that range.
c) Construct the cumulative frequency distribution and determine the rainfall level below which 75% of the
days fall.
d) Calculate the estimated variance and standard deviation of the daily rainfall based on the histogram data.
Chapter 10 Solutions
Elementary Statistics: A Step By Step Approach
Ch. 10.1 - Stopping Distances In a study on speed control, it...Ch. 10.1 - What is meant by the statement that two variables...Ch. 10.1 - How is a linear relationship between two variables...Ch. 10.1 - What is the symbol for the sample correlation...Ch. 10.1 - What is the range of values for the correlation...Ch. 10.1 - What is meant when the relationship between the...Ch. 10.1 - Give examples of two variables that are positively...Ch. 10.1 - What is the diagram of the independent and...Ch. 10.1 - What is the name of the correlation coefficient...Ch. 10.1 - What statistical test is used to test the...
Ch. 10.1 - When two variables are correlated, can the...Ch. 10.1 - For Exercises 11 through 27, perform the following...Ch. 10.1 - For Exercises 11 through 27, perform the following...Ch. 10.1 - For Exercises 11 through 27, perform the following...Ch. 10.1 - For Exercises 11 through 27, perform the following...Ch. 10.1 - For Exercises 11 through 27, perform the following...Ch. 10.1 - For Exercises 11 through 27, perform the following...Ch. 10.1 - For Exercises 11 through 27, perform the following...Ch. 10.1 - For Exercises 11 through 27, perform the following...Ch. 10.1 - For Exercises 11 through 27, perform the following...Ch. 10.1 - For Exercises 11 through 27, perform the following...Ch. 10.1 - For Exercises 11 through 27, perform the following...Ch. 10.1 - For Exercises 11 through 27, perform the following...Ch. 10.1 - Prob. 23ECh. 10.1 - For Exercises 11 through 27, perform the following...Ch. 10.1 - For Exercises 11 through 27, perform the following...Ch. 10.1 - For Exercises 11 through 27, perform the following...Ch. 10.1 - Prob. 27ECh. 10.1 - Prob. 28ECCh. 10.1 - Prob. 29ECCh. 10.1 - Prob. 30ECCh. 10.2 - Applying the Concepts 102 Stopping Distances...Ch. 10.2 - What two things should be done before one performs...Ch. 10.2 - What are the assumptions for regression analysis?Ch. 10.2 - Prob. 3ECh. 10.2 - What is the symbol for the slope? For the y...Ch. 10.2 - Prob. 5ECh. 10.2 - When all the points fall on the regression line,...Ch. 10.2 - What is the relationship between the sign of the...Ch. 10.2 - As the value of the correlation coefficient...Ch. 10.2 - Prob. 9ECh. 10.2 - When the value of r is not significant, what value...Ch. 10.2 - For Exercises 11 through 27, use the same data as...Ch. 10.2 - Prob. 12ECh. 10.2 - For Exercises 11 through 27, use the same data as...Ch. 10.2 - For Exercises 11 through 27, use the same data as...Ch. 10.2 - For Exercises 11 through 27, use the same data as...Ch. 10.2 - For Exercises 11 through 27, use the same data as...Ch. 10.2 - Prob. 17ECh. 10.2 - For Exercises 11 through 27, use the same data as...Ch. 10.2 - For Exercises 11 through 27, use the same data as...Ch. 10.2 - For Exercises 11 through 27, use the same data as...Ch. 10.2 - For Exercises 11 through 27, use the same data as...Ch. 10.2 - For Exercises 11 through 27, use the same data as...Ch. 10.2 - For Exercises 11 through 27, use the same data as...Ch. 10.2 - For Exercises 11 through 27, use the same data as...Ch. 10.2 - Prob. 25ECh. 10.2 - Prob. 26ECh. 10.2 - For Exercises 11 through 27, use the same data as...Ch. 10.2 - For Exercises 28 through 33, do a complete...Ch. 10.2 - Prob. 29ECh. 10.2 - For Exercises 28 through 33, do a complete...Ch. 10.2 - For Exercises 28 through 33, do a complete...Ch. 10.2 - For Exercises 28 through 33, do a complete...Ch. 10.2 - Prob. 33ECh. 10.2 - For Exercises 34 and 35, do a complete regression...Ch. 10.2 - For Exercises 34 and 35, do a complete regression...Ch. 10.2 - For Exercises 13, 15, and 21 in Section 101, find...Ch. 10.2 - The y intercept value a can also be found by using...Ch. 10.2 - The value of the correlation coefficient can also...Ch. 10.3 - Applying the Concepts 103 Interpreting Simple...Ch. 10.3 - What is meant by the explained variation? How is...Ch. 10.3 - What is meant by the unexplained variation? How is...Ch. 10.3 - What is meant by the total variation? How is it...Ch. 10.3 - Define the coefficient of determination.Ch. 10.3 - How is the coefficient of determination found?Ch. 10.3 - Define the coefficient of nondetermination.Ch. 10.3 - How is the coefficient of nondetermination found?Ch. 10.3 - Prob. 8ECh. 10.3 - Prob. 9ECh. 10.3 - Prob. 10ECh. 10.3 - Prob. 11ECh. 10.3 - Prob. 12ECh. 10.3 - Prob. 13ECh. 10.3 - Prob. 14ECh. 10.3 - Prob. 15ECh. 10.3 - Compute the standard error of the estimate for...Ch. 10.3 - Compute the standard error of the estimate for...Ch. 10.3 - Compute the standard error of the estimate for...Ch. 10.3 - Prob. 19ECh. 10.3 - For the data in Exercises 14 in Sections 101 and...Ch. 10.3 - Prob. 21ECh. 10.3 - Prob. 22ECh. 10.4 - Applying the Concepts 104 More Math Means More...Ch. 10.4 - Explain the similarities and differences between...Ch. 10.4 - What is the general form of the multiple...Ch. 10.4 - Prob. 3ECh. 10.4 - Prob. 4ECh. 10.4 - How do the values of the individual correlation...Ch. 10.4 - Age, GPA, and Income A researcher has determined...Ch. 10.4 - Nursing Home Satisfaction A researcher found that...Ch. 10.4 - Special Occasion Cakes A pastry chef who...Ch. 10.4 - Aspects of Students Academic Behavior A college...Ch. 10.4 - Age, Cholesterol, and Sodium A medical researcher...Ch. 10.4 - Explain the meaning of the multiple correlation...Ch. 10.4 - What is the range of values R can assume?Ch. 10.4 - Prob. 13ECh. 10.4 - What are the hypotheses used to test the...Ch. 10.4 - What test is used to test the significance of R?Ch. 10.4 - What is the meaning of the adjusted R2? Why is it...Ch. 10 - For Exercises 1 through 7, do a complete...Ch. 10 - For Exercises 1 through 7, do a complete...Ch. 10 - For Exercises 1 through 7, do a complete...Ch. 10 - For Exercises 1 through 7, do a complete...Ch. 10 - For Exercises 1 through 7, do a complete...Ch. 10 - For Exercises 1 through 7, do a complete...Ch. 10 - For Exercises 1 through 7, do a complete...Ch. 10 - For Exercise 4, find the standard error of the...Ch. 10 - Prob. 10.3.9RECh. 10 - Prob. 10.3.10RECh. 10 - Prob. 10.3.11RECh. 10 - Prob. 10.3.12RECh. 10 - (Opt.) A study found a significant relationship...Ch. 10 - Prob. 10.4.14RECh. 10 - Prob. 10.4.15RECh. 10 - Prob. 1CQCh. 10 - Determine whether each statement is true or false....Ch. 10 - Determine whether each statement is true or false....Ch. 10 - Determine whether each statement is true or false....Ch. 10 - Determine whether each statement is true or false....Ch. 10 - Determine whether each statement is true or false....Ch. 10 - Prob. 7CQCh. 10 - Select the best answer. 8. To test the...Ch. 10 - Select the best answer. 9. The test of...Ch. 10 - Prob. 10CQCh. 10 - Prob. 11CQCh. 10 - Prob. 12CQCh. 10 - Complete the following statements with the best...Ch. 10 - Prob. 14CQCh. 10 - Prob. 15CQCh. 10 - Prob. 16CQCh. 10 - Prob. 17CQCh. 10 - Prob. 18CQCh. 10 - Prob. 19CQCh. 10 - Prob. 20CQCh. 10 - Prob. 21CQCh. 10 - Prob. 22CQCh. 10 - Prob. 23CQCh. 10 - For Exercise 20, find the 90% prediction interval...Ch. 10 - Prob. 25CQCh. 10 - Prob. 26CQCh. 10 - (Opt.) Find R when ryx1 = 0.561 and ryx2 = 0.714...Ch. 10 - Prob. 28CQCh. 10 - Prob. 1CTCCh. 10 - Prob. 2CTCCh. 10 - Prob. 3CTCCh. 10 - Prob. 4CTCCh. 10 - Product Sales When the points in a scatter plot...Ch. 10 - Prob. 6CTCCh. 10 - Prob. 7CTCCh. 10 - Product Sales When the points in a scatter plot...Ch. 10 - Prob. 9CTC
Knowledge Booster


Learn more about
Need a deep-dive on the concept behind this application? Look no further. Learn more about this topic, statistics and related others by exploring similar questions and additional content below.Similar questions
- An electronics company manufactures batches of n circuit boards. Before a batch is approved for shipment, m boards are randomly selected from the batch and tested. The batch is rejected if more than d boards in the sample are found to be faulty. a) A batch actually contains six faulty circuit boards. Find the probability that the batch is rejected when n = 20, m = 5, and d = 1. b) A batch actually contains nine faulty circuit boards. Find the probability that the batch is rejected when n = 30, m = 10, and d = 1.arrow_forwardTwenty-eight applicants interested in working for the Food Stamp program took an examination designed to measure their aptitude for social work. A stem-and-leaf plot of the 28 scores appears below, where the first column is the count per branch, the second column is the stem value, and the remaining digits are the leaves. a) List all the values. Count 1 Stems Leaves 4 6 1 4 6 567 9 3688 026799 9 8 145667788 7 9 1234788 b) Calculate the first quartile (Q1) and the third Quartile (Q3). c) Calculate the interquartile range. d) Construct a boxplot for this data.arrow_forwardPam, Rob and Sam get a cake that is one-third chocolate, one-third vanilla, and one-third strawberry as shown below. They wish to fairly divide the cake using the lone chooser method. Pam likes strawberry twice as much as chocolate or vanilla. Rob only likes chocolate. Sam, the chooser, likes vanilla and strawberry twice as much as chocolate. In the first division, Pam cuts the strawberry piece off and lets Rob choose his favorite piece. Based on that, Rob chooses the chocolate and vanilla parts. Note: All cuts made to the cake shown below are vertical.Which is a second division that Rob would make of his share of the cake?arrow_forward
- Three players (one divider and two choosers) are going to divide a cake fairly using the lone divider method. The divider cuts the cake into three slices (s1, s2, and s3). If the choosers' declarations are Chooser 1: {s1 , s2} and Chooser 2: {s2 , s3}. Using the lone-divider method, how many different fair divisions of this cake are possible?arrow_forwardTheorem 2.6 (The Minkowski inequality) Let p≥1. Suppose that X and Y are random variables, such that E|X|P <∞ and E|Y P <00. Then X+YpX+Yparrow_forwardTheorem 1.2 (1) Suppose that P(|X|≤b) = 1 for some b > 0, that EX = 0, and set Var X = 0². Then, for 0 0, P(X > x) ≤e-x+1²² P(|X|>x) ≤2e-1x+1²² (ii) Let X1, X2...., Xn be independent random variables with mean 0, suppose that P(X ≤b) = 1 for all k, and set oσ = Var X. Then, for x > 0. and 0x) ≤2 exp Σ k=1 (iii) If, in addition, X1, X2, X, are identically distributed, then P(S|x) ≤2 expl-tx+nt²o).arrow_forward
- Theorem 5.1 (Jensen's inequality) state without proof the Jensen's Ineg. Let X be a random variable, g a convex function, and suppose that X and g(X) are integrable. Then g(EX) < Eg(X).arrow_forwardCan social media mistakes hurt your chances of finding a job? According to a survey of 1,000 hiring managers across many different industries, 76% claim that they use social media sites to research prospective candidates for any job. Calculate the probabilities of the following events. (Round your answers to three decimal places.) answer parts a-c. a) Out of 30 job listings, at least 19 will conduct social media screening. b) Out of 30 job listings, fewer than 17 will conduct social media screening. c) Out of 30 job listings, exactly between 19 and 22 (including 19 and 22) will conduct social media screening. show all steps for probabilities please. answer parts a-c.arrow_forwardQuestion: we know that for rt. (x+ys s ا. 13. rs. and my so using this, show that it vye and EIXI, EIYO This : E (IX + Y) ≤2" (EIX (" + Ely!")arrow_forward
- Theorem 2.4 (The Hölder inequality) Let p+q=1. If E|X|P < ∞ and E|Y| < ∞, then . |EXY ≤ E|XY|||X|| ||||qarrow_forwardTheorem 7.6 (Etemadi's inequality) Let X1, X2, X, be independent random variables. Then, for all x > 0, P(max |S|>3x) ≤3 max P(S| > x). Isk≤narrow_forwardTheorem 7.2 Suppose that E X = 0 for all k, that Var X = 0} x) ≤ 2P(S>x 1≤k≤n S√2), -S√2). P(max Sk>x) ≤ 2P(|S|>x- 1arrow_forwardarrow_back_iosSEE MORE QUESTIONSarrow_forward_ios
Recommended textbooks for you
 Algebra and Trigonometry (MindTap Course List)AlgebraISBN:9781305071742Author:James Stewart, Lothar Redlin, Saleem WatsonPublisher:Cengage Learning
 College AlgebraAlgebraISBN:9781305115545Author:James Stewart, Lothar Redlin, Saleem WatsonPublisher:Cengage Learning
 Functions and Change: A Modeling Approach to Coll...AlgebraISBN:9781337111348Author:Bruce Crauder, Benny Evans, Alan NoellPublisher:Cengage Learning
 Glencoe Algebra 1, Student Edition, 9780079039897...AlgebraISBN:9780079039897Author:CarterPublisher:McGraw Hill
 Trigonometry (MindTap Course List)TrigonometryISBN:9781305652224Author:Charles P. McKeague, Mark D. TurnerPublisher:Cengage Learning
Algebra and Trigonometry (MindTap Course List)
Algebra
ISBN:9781305071742
Author:James Stewart, Lothar Redlin, Saleem Watson
Publisher:Cengage Learning
College Algebra
Algebra
ISBN:9781305115545
Author:James Stewart, Lothar Redlin, Saleem Watson
Publisher:Cengage Learning
Functions and Change: A Modeling Approach to Coll...
Algebra
ISBN:9781337111348
Author:Bruce Crauder, Benny Evans, Alan Noell
Publisher:Cengage Learning
Glencoe Algebra 1, Student Edition, 9780079039897...
Algebra
ISBN:9780079039897
Author:Carter
Publisher:McGraw Hill
Trigonometry (MindTap Course List)
Trigonometry
ISBN:9781305652224
Author:Charles P. McKeague, Mark D. Turner
Publisher:Cengage Learning
Correlation Vs Regression: Difference Between them with definition & Comparison Chart; Author: Key Differences;https://www.youtube.com/watch?v=Ou2QGSJVd0U;License: Standard YouTube License, CC-BY
Correlation and Regression: Concepts with Illustrative examples; Author: LEARN & APPLY : Lean and Six Sigma;https://www.youtube.com/watch?v=xTpHD5WLuoA;License: Standard YouTube License, CC-BY