
Concept explainers
To determine: The difference shown by the second set of sample from the first one.
Introduction
Company TT is a division of company DM. It was about to launch a new product. Ms. MY, the
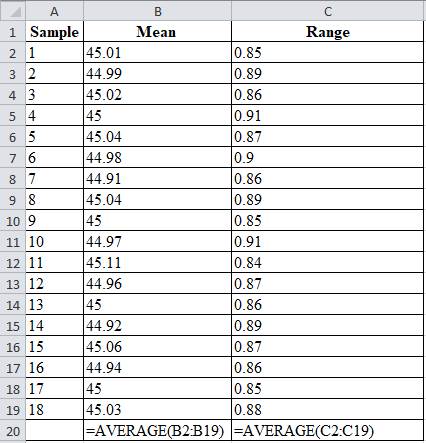
Table 1
| Sample | Mean | Range |
| 1 | 45.01 | 0.85 |
| 2 | 44.99 | 0.89 |
| 3 | 45.02 | 0.86 |
| 4 | 45 | 0.91 |
| 5 | 45.04 | 0.87 |
| 6 | 44.98 | 0.9 |
| 7 | 44.91 | 0.86 |
| 8 | 45.04 | 0.89 |
| 9 | 45 | 0.85 |
| 10 | 44.97 | 0.91 |
| 11 | 45.11 | 0.84 |
| 12 | 44.96 | 0.87 |
| 13 | 45 | 0.86 |
| 14 | 44.92 | 0.89 |
| 15 | 45.06 | 0.87 |
| 16 | 44.94 | 0.86 |
| 17 | 45 | 0.85 |
| 18 | 45.03 | 0.88 |
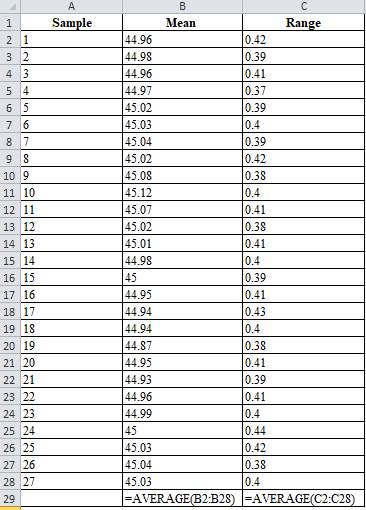
Quiet disappointed with the end results, the manager was figuring out ways to improve the process and free the capital expenditure of $10,000. A former professor suggested going for more samples with less sample sizes. JM conducted the analysis on 27 samples of 5 observations each and the results are tabulated below:
Table 2
| Sample | Mean | Range |
| 1 | 44.96 | 0.42 |
| 2 | 44.98 | 0.39 |
| 3 | 44.96 | 0.41 |
| 4 | 44.97 | 0.37 |
| 5 | 45.02 | 0.39 |
| 6 | 45.03 | 0.4 |
| 7 | 45.04 | 0.39 |
| 8 | 45.02 | 0.42 |
| 9 | 45.08 | 0.38 |
| 10 | 45.12 | 0.4 |
| 11 | 45.07 | 0.41 |
| 12 | 45.02 | 0.38 |
| 13 | 45.01 | 0.41 |
| 14 | 44.98 | 0.4 |
| 15 | 45 | 0.39 |
| 16 | 44.95 | 0.41 |
| 17 | 44.94 | 0.43 |
| 18 | 44.94 | 0.4 |
| 19 | 44.87 | 0.38 |
| 20 | 44.95 | 0.41 |
| 21 | 44.93 | 0.39 |
| 22 | 44.96 | 0.41 |
| 23 | 44.99 | 0.4 |
| 24 | 45 | 0.44 |
| 25 | 45.03 | 0.42 |
| 26 | 45.04 | 0.38 |
| 27 | 45.03 | 0.4 |
Answer to Problem 2.2CQ
Explanation of Solution
Given information:
Table 3
| Sample | Mean | Range |
| 1 | 45.01 | 0.85 |
| 2 | 44.99 | 0.89 |
| 3 | 45.02 | 0.86 |
| 4 | 45 | 0.91 |
| 5 | 45.04 | 0.87 |
| 6 | 44.98 | 0.9 |
| 7 | 44.91 | 0.86 |
| 8 | 45.04 | 0.89 |
| 9 | 45 | 0.85 |
| 10 | 44.97 | 0.91 |
| 11 | 45.11 | 0.84 |
| 12 | 44.96 | 0.87 |
| 13 | 45 | 0.86 |
| 14 | 44.92 | 0.89 |
| 15 | 45.06 | 0.87 |
| 16 | 44.94 | 0.86 |
| 17 | 45 | 0.85 |
| 18 | 45.03 | 0.88 |
Formula:
Mean Chart:
Difference shown by the second set of sample from the first one:
Date set:1
Table 4
| Sample | Mean | Range |
| 1 | 45.01 | 0.85 |
| 2 | 44.99 | 0.89 |
| 3 | 45.02 | 0.86 |
| 4 | 45 | 0.91 |
| 5 | 45.04 | 0.87 |
| 6 | 44.98 | 0.9 |
| 7 | 44.91 | 0.86 |
| 8 | 45.04 | 0.89 |
| 9 | 45 | 0.85 |
| 10 | 44.97 | 0.91 |
| 11 | 45.11 | 0.84 |
| 12 | 44.96 | 0.87 |
| 13 | 45 | 0.86 |
| 14 | 44.92 | 0.89 |
| 15 | 45.06 | 0.87 |
| 16 | 44.94 | 0.86 |
| 17 | 45 | 0.85 |
| 18 | 45.03 | 0.88 |
| 45 | 0.872777778 |
Excel worksheet:
From factors of three-sigma chart, for n=20, A2 = 0.18; D3 = 0.41; D4 = 1.59
Mean control chart:
Range control chart:
Upper control limit:
The upper control limit is calculated by adding the product of 0.18 and 0.873 with 45, which yields 45.156.
Lower control limit:
The lower control limit is calculated by subtracting the product of 0.18 and 0.873 with 45, which yields 44.842.
A graph is plotted using the UCL, LCL and samples values.
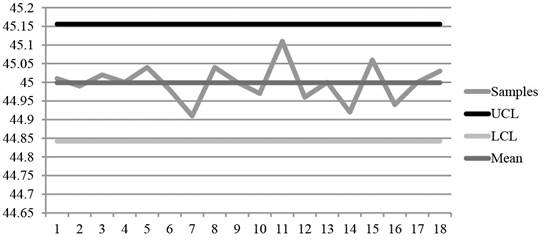
Diagram 1
Date set: 2
Table 5
| Sample | Mean | Range |
| 1 | 44.96 | 0.42 |
| 2 | 44.98 | 0.39 |
| 3 | 44.96 | 0.41 |
| 4 | 44.97 | 0.37 |
| 5 | 45.02 | 0.39 |
| 6 | 45.03 | 0.4 |
| 7 | 45.04 | 0.39 |
| 8 | 45.02 | 0.42 |
| 9 | 45.08 | 0.38 |
| 10 | 45.12 | 0.4 |
| 11 | 45.07 | 0.41 |
| 12 | 45.02 | 0.38 |
| 13 | 45.01 | 0.41 |
| 14 | 44.98 | 0.4 |
| 15 | 45 | 0.39 |
| 16 | 44.95 | 0.41 |
| 17 | 44.94 | 0.43 |
| 18 | 44.94 | 0.4 |
| 19 | 44.87 | 0.38 |
| 20 | 44.95 | 0.41 |
| 21 | 44.93 | 0.39 |
| 22 | 44.96 | 0.41 |
| 23 | 44.99 | 0.4 |
| 24 | 45 | 0.44 |
| 25 | 45.03 | 0.42 |
| 26 | 45.04 | 0.38 |
| 27 | 45.03 | 0.4 |
| 44.9959 | 0.40111 |
Excel worksheet:
From factors of three-sigma chart, for n=20, A2 = 0.58
Mean control chart:
Range control chart:
Upper control limit:
The upper control limit is calculated by adding the product of 0.58 and 0.401 with 44.99, which yields 45.229.
Lower control limit:
The lower control limit is calculated by subtracting the product of 0.58 and 0.401 with 44.99, which yields 44.763.
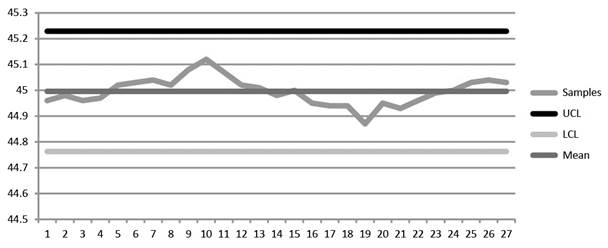
Diagram 2
On comparing Diagrams 1 and 2, it is evident that the second set of data has closer range of changes while the first set of data is scattered and reveals no information about the changes in the process.
Hence, the second sample reveals the changes in the process changes more clearly than the first set of data.
Want to see more full solutions like this?
Chapter 10 Solutions
OPERATIONS MANAGEMENT(LL)-W/CONNECT


- in the 2016 "ATB: Digital Disruption in the parking meter industry" case what recommendations would you give to adress the key issues outlined in the case?arrow_forward1) JIT McDonald’s Style (https://media.gaspar.mheducation.com/GASPARPlayer/play.html?id=46KGfedfilYlJzWH4XxxbLS) What challenges did McDonald’s face with its current operating system? 2. What are the five criteria that McDonald’s new “Made for You” operating system had to meet? 3. Describe how the “Made for You” operating system works.arrow_forwardThe first general topic debated in the SHRM Learning System centers around talent acquisition and retention. Discuss how talent is different from skills, and offer two strategies a human resources professional can pursue to recruit “talent” to an organization.arrow_forward
- What assumptions or biases do you have related to the case? Gather the facts. Known and to be gathered. Identify the stakeholders and their viewpoints. Include the values, obligations and interests of each of the stakeholders. Primary Secondaryarrow_forwardPerform an internal analysis using SWOT and VRIO analysis of the " ATB: Digital disruption in the parking meter industry" casearrow_forwardPerform a External analysis using PESTEL and Porters five force analysis on the "ATB: Digital disruption in the parking meter industry" casearrow_forward
- There was a most recent poll for which 571 adults that flew in the past year had info collected. This info was their number 1 complaints about flying. A - small cramped seat - 45 complaints B - cost - 18 complaints C - fear or dislike - 81 complaints D - security - 123 complaints E - Poor service - 12 complaints F - Conntected flight issue - 8 complaints G - overcrowded - 41 complaints H - Late and wait - 81 complaints I - Food - 5 complaints J - Lost/missing luggage - 5 complaints K - Other - 51 complaints What percentage of those surveyed found nothing they didnt dislike?arrow_forwardCan you help me with this, and explain what a product by value analysis is? Thanks in advancearrow_forwardOperations Management Questionarrow_forward
- can you explain and breakdown the "ATB: digital disruption in the parking meter industry" case in detail outlining the key issuesarrow_forwardAt Quick Car Wash, the wash process is advertised to take less than 6 minutes. Consequently, management has set a target average of 330 seconds for the wash process. Suppose the average range for a sample of 7 cars is 10 seconds. Use the accompanying table to establish control limits for sample means and ranges for the car wash process. Click the icon to view the table of factors for calculating three-sigma limits for the x-chart and R-chart. The UCLR equals seconds and the LCLR equals seconds. (Enter your responses rounded to two decimal places.)arrow_forwardIf Jeremy who is the VP for the operations, proceeds with their existing prototype (which is option a), the firm can then expect sales to be 120,000 units at $550 each. And with a probability of 0.52 and a 0.48 probability of 65,000 at $550. we However, he uses his value analysis team (option b), the firm expects sales of 75,000 units at $770, with a probability of 0.78 and a 0.22 probability of 65,000 units at $770. Value engineering, at a cost of $100,000, is only used in option b. Which option for this has the highest expected monetary value (EMV)? The EMV for option a is $? The EMV for option b is $? Which has the highest expected monetary value. A or B?arrow_forward
 Practical Management ScienceOperations ManagementISBN:9781337406659Author:WINSTON, Wayne L.Publisher:Cengage,
 Foundations of Business (MindTap Course List)MarketingISBN:9781337386920Author:William M. Pride, Robert J. Hughes, Jack R. KapoorPublisher:Cengage Learning
 Foundations of Business - Standalone book (MindTa...MarketingISBN:9781285193946Author:William M. Pride, Robert J. Hughes, Jack R. KapoorPublisher:Cengage Learning