Concept explainers
a)
To construct: A
Introduction: Quality is a measure of excellence or a state of being free from deficiencies, defects and important variations. It is obtained by consistent and strict commitment to certain standards to attain uniformity of a product to satisfy consumers’ requirement.
a)
Answer to Problem 12P
Explanation of Solution
Given information:
| Sample | Mean | Sample | Mean | Sample | Mean | Sample | Mean |
| 1 | 3.86 | 11 | 3.88 | 21 | 3.84 | 31 | 3.88 |
| 2 | 3.90 | 12 | 3.86 | 22 | 3.82 | 32 | 3.76 |
| 3 | 3.83 | 13 | 3.88 | 23 | 3.89 | 33 | 3.83 |
| 4 | 3.81 | 14 | 3.81 | 24 | 3.86 | 34 | 3.77 |
| 5 | 3.84 | 15 | 3.83 | 25 | 3.88 | x35 | 3.86 |
| 6 | 3.83 | 16 | 3.86 | 26 | 3.90 | 36 | 3.80 |
| 7 | 3.87 | 17 | 3.82 | 27 | 3.81 | 37 | 3.84 |
| 8 | 3.88 | 18 | 3.86 | 28 | 3.86 | 38 | 3.79 |
| 9 | 3.84 | 19 | 3.84 | 29 | 3.98 | 39 | 3.85 |
| 10 | 3.80 | 20 | 3.87 | 30 | 3.96 |
Formula:
Calculation of control limits and construction of
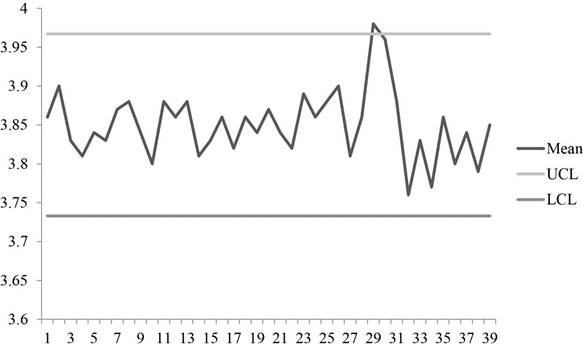
Graph shows the plot for sample means with UCL and LCL values. It can be observed that some points are above the control limits. So, the process is out of control.
Hence, the process is not in control.
b)
To analyze: The data using median run test and up and down run test and conclude the results.
Introduction: Quality is a measure of excellence or a state of being free from deficiencies, defects and important variations. It is obtained by consistent and strict commitment to certain standards to attain uniformity of a product to satisfy consumers’ requirement.
b)
Answer to Problem 12P
Explanation of Solution
Given information:
| Sample | Mean | Sample | Mean | Sample | Mean | Sample | Mean |
| 1 | 3.86 | 11 | 3.88 | 21 | 3.84 | 31 | 3.88 |
| 2 | 3.90 | 12 | 3.86 | 22 | 3.82 | 32 | 3.76 |
| 3 | 3.83 | 13 | 3.88 | 23 | 3.89 | 33 | 3.83 |
| 4 | 3.81 | 14 | 3.81 | 24 | 3.86 | 34 | 3.77 |
| 5 | 3.84 | 15 | 3.83 | 25 | 3.88 | x35 | 3.86 |
| 6 | 3.83 | 16 | 3.86 | 26 | 3.90 | 36 | 3.80 |
| 7 | 3.87 | 17 | 3.82 | 27 | 3.81 | 37 | 3.84 |
| 8 | 3.88 | 18 | 3.86 | 28 | 3.86 | 38 | 3.79 |
| 9 | 3.84 | 19 | 3.84 | 29 | 3.98 | 39 | 3.85 |
| 10 | 3.80 | 20 | 3.87 | 30 | 3.96 |
Formula:
Analysis of data:
To make analysis of data, the given data is compared with median 3.85 to make A/B and U/D.
| Sample | A/B | Mean | U/D | Sample | A/B | Mean | U/D |
| 1 | A | 3.86 | - | 21 | B | 3.84 | D |
| 2 | A | 3.90 | U | 22 | B | 3.82 | D |
| 3 | B | 3.83 | D | 23 | A | 3.89 | U |
| 4 | B | 3.81 | D | 24 | A | 3.86 | D |
| 5 | B | 3.84 | U | 25 | A | 3.88 | U |
| 6 | B | 3.83 | D | 26 | A | 3.90 | U |
| 7 | A | 3.87 | U | 27 | B | 3.81 | D |
| 8 | A | 3.88 | U | 28 | A | 3.86 | U |
| 9 | B | 3.84 | D | 29 | A | 3.98 | U |
| 10 | B | 3.80 | D | 30 | A | 3.96 | D |
| 11 | A | 3.88 | U | 31 | A | 3.88 | D |
| 12 | A | 3.86 | D | 32 | B | 3.76 | D |
| 13 | A | 3.88 | U | 33 | B | 3.83 | U |
| 14 | B | 3.81 | D | 34 | B | 3.77 | D |
| 15 | B | 3.83 | U | 35 | A | 3.86 | U |
| 16 | A | 3.86 | U | 36 | B | 3.80 | D |
| 17 | B | 3.82 | D | 37 | B | 3.84 | U |
| 18 | A | 3.86 | U | 38 | B | 3.79 | D |
| 19 | B | 3.84 | D | 39 | B | 3.85 | U |
| 20 | A | 3.87 | U |
Sample 39 ties with the median and in order to maximize the Ztest statistics, the sample 39 is labeled as B. Therefore, the observed number of runs is 18.
Median run test:
Calculation of expected number of runs:
The expected number of runs is calculated by adding half of the total number of samples with 1 which gives 20.5.
Calculation of standard deviation:
Standard deviation is calculated by subtracting number of sample 39 from 1 and dividing the resultant by 4 and taking square for the value which yields 3.08.
The z factor for median is calculated by dividing the difference of 18 and 20.5 with 3.08 which yields -0.81 which is within the test statistics of ±2.
Up/Down Test:
The observed number of runs from the analysis is 29.
Calculation of expected number of runs:
The expected number of runs is calculated by subtracting the double of the number of samples 39 and subtracting from1 and dividing the resultant with 3 which gives 25.7.
Calculation of standard deviation:
Standard deviation is calculated by multiplying the number of samples with 16 and subtracting the resultant from 29 and then dividing the resulting value with 90 and taking square root which yields 2.57.
The z factor for median is calculated by dividing the difference of 29 and 25.7 with 2.57 which yields +1.28 which is within the test statistics of ±2.
Hence, the results of the median run test and up/down test is random and no non randomness is detected.
Want to see more full solutions like this?
Chapter 10 Solutions
OPERATIONS MANAGEMENT(LL)-W/CONNECT


- Work with the chef and/or production manager to identify a menu item (or potential menu item) for which a standardized recipe is needed. Record the recipe with which you started and expand it to meet the number of servings required by the facility. Develop an evaluation rubric. Conduct an evaluation of the product. There should be three or more people evaluating the product for quality. Write a brief report of this activity • Product chosen and the reason why it was selected When and where the facility could use the product The standardized recipe sheet or card 。 o Use the facility's format or Design one of your own using a form of your choice; be sure to include the required elements • • Recipe title Yield and portion size Cooking time and temperature Ingredients and quantities Specify AP or EP Procedures (direction)arrow_forwardASSIGNMENT: Inventory, Answer the following questions 1. How does the facility survey inventory? 2. Is there a perpetual system in place? 3. How often do they do a physical inventory? 4. Participate in taking inventory. 5. Which type of stock system does the facility use? A. Minimum stock- includes a safety factor for replenishing stock B. Maximum stock- equal to a safety stock plus estimated usage (past usage and forecasts) C. Mini-max-stock allowed to deplete to a safety level before a new order is submitted to bring up inventory up to max again D. Par stock-stock brought up to the par level each time an order is placed regardless of the amount on hand at the time of order E. Other-(describe) Choose an appropriate product and determine how much of an item should be ordered. Remember the formula is: Demand during lead time + safety stock = amount to order Cost out an inventory according to data supplied. Remember that to do this, you will need to take an inventory, and will need to…arrow_forwardHuman Relations, Systems, and Organization Assignments ORGANIZATION: Review the organization chart for the facility • Draw an organization chart for the department. • . Identify and explain the relationships of different units in the organization and their importance to maintain the food service department's mission. Include a copy in your weekly submission. There is a feature in PowerPoint for doing this should you want to use it. JOB ORGANIZATION: ⚫ A job description is a broad, general, and written statement for a specific job, based on the findings of a job analysis. It generally includes duties, purpose, responsibilities, scope, and working conditions of a job along with the job's title, and the name or designation of the person to whom the employee reports. Job description usually forms the basis of job specification. • Work with your preceptor or supervisor to identify a position for which you will write a job description. Include a copy of the job description you write in your…arrow_forward
- ASSIGNMENT: Production Sheet Watch at least 3 workers prepare foods. Write down what they do and the amount of time it takes for them to complete the task. Calculate the production cost. Example: Food Item: Green Beans Time Worker #1 Worker #2 Worker #3 Start End Time (Hours) Time Time Activity Activity Activity (Hours) (Hours) 11:45 am 12:01 pm 0.27 Steam and 0.05 Microwave blenderize pureed frozen green green beans beans 16.25 Total Production Time 3 minutes minutes Hourly Wage $16.07 $12.28 24% Benefits *** $3.86 $2.95 Labor Costs $5.37 $0.76 *** Check with facility to see Benefit %arrow_forwardMenu Planning and Quality Monitoring Rotation site: Hospital/Commercial Foodservice Rotation Objectives: Menu development (this will be your Theme Meal) 1. Develop a modified menu (vegetarian, vegan, gluten-free, etc.) that is appropriate in texture, color, flavor, eye appeal, temperature, and methods of preparation. 2. Develop a menu that takes into consideration food preferences due to clients' ethnicity and age group. 3. Develop menus that fulfill the nutritional needs of the target population. 4. Develop a modified menu that maintains consistency with a regular menu. 5. Demonstrate knowledge of operational constraints and limitations when designing menus 6. Identify appropriate type and amounts of foods for an emergency plan. ACTIVITY: Quality improvement monitoring 1. Participates in rounds to get feedback from clients on Theme Meal menu. 2. Takes corrective actions if necessary according to results of the quality measures 3. Completes one or more critical incident reports for the…arrow_forwardWork with the chef and/or production manager to identify a menu item (or potential menu item) for which a standardized recipe is needed. Record the recipe with which you started and expand it to meet the number of servings required by the facility. Develop an evaluation rubric. Conduct an evaluation of the product. There should be three or more people evaluating the product for quality. Write a brief report of this activity • Product chosen and the reason why it was selected When and where the facility could use the product The standardized recipe sheet or card ○ Use the facility's format or о Design one of your own using a form of your choice; be sure to include the required elements Recipe title " Yield and portion size ■ Cooking time and temperature Ingredients and quantities Specify AP or EP Procedures (direction)arrow_forward
- Item Prepared: Work with one or more cold food production workers to learn job descriptions, flow of work, how the menu items are prepared and served, and needs for further training or process improvement. Document a specific menu item you prepared. Record the temperature of a product when it goes into the refrigerator or blast chiller. Record how long it took for the product to cool to the appropriate temperature. Evaluate the menu item you were involved in preparing. Follow the product and process to completion and utilize resources to correct any wrong procedures you observe. Take your notes and write a brief report of the actual experience based on the following criteria: 1. Pre-preparation 2. Preparation 3. Compare menu item to diets it is used for by completing a nutritional analysis 4. Temperatures during and after preparation. 5. Tray service to patient or guest (how it looks, holds up, appropriate temperature maintained from production through delivery) 6. Waste disposal (what…arrow_forwardWork with one or more hot food production workers to learn job descriptions, flow of work, how the menu items are prepared and served, and needs for further training or process improvement. Document a specific menu item you prepared. Record the temperature of a product when it is done. If it is to be chilled and reheated later, systematically measure the temperature every 30 minutes and record how long it takes the product to reach a safe temperature for storage. Evaluate the menu item you were involved in preparing. Follow the product and process to completion and utilize resources to correct any wrong procedures you observe. Take notes and write a brief report of the actual experience based on the following criteria: 1. Pre-preparation 2. Preparation 3. Compare menu item to diets it is used for by completing a nutritional analysis 4. Temperatures during and after preparation. 5. Tray service to patient or guest (how it looks, holds up, appropriate temperature maintained from…arrow_forwardRefrigerated/Freezer- Dietary Mangement (Nursing Home) Describe the refrigerated/freezer storage area and procedures. Are any of the refrigerated/ frozen areas locked? Who has access? What kind of shelving is used? Are there any products stored on the floor? Are the items dated as received? How is the stock rotated to ensure that the oldest items are used first? Are temperature and humidity monitored? If yes, how? Has mold ever been a problem? Are there any regular procedures in place to control it? How often are the refrigerated/freezer storage areas cleaned?arrow_forward
- RECEIVING AND STORAGE ASSIGNMENTS- Dietary Mangement (Nursing Home) ASSIGNMENT: Diagram the receiving and storage areas. Use arrows to show the flow of goods as they are received and moved to storage. ASSIGNMENT: In order to accurately understand this area, the intern should work in the receiving area to complete the following assignments and answer the following questions: Inspect the delivery and check it against the purchase Inspect the delivery against the invoice Accept order only if all quantities and quality specifications are met Check perishable items first Check temperatures of refrigerated and frozen items on arrival Look for evidence of thawing or freezer burn Randomly open cases to check contents Complete receiving records Transfer goods to appropriate storage Who checks the packing slip against the invoice? Does the facility ever use “blind” receiving where the receiving clerk checks the order against an invoice where the amounts have been blanked out and the clerk…arrow_forwardPurchasing, Receiving, Storage, and Inventory Instructions- Dietary management in a nursing home in ABQ NM What workers are involved in the purchasing, receiving, storage and inventory process. Complete the table below: Position Description of their job duties Date/ What did they do? Answer the questions below: PURCHASING: 1. Is there a centralized purchasing department for the facility? If yes, observe someone in that department for a half day if possible, if no write N/A 2. What kinds of items are required to go out for formal bid? 3. What about capital purchases? What is the dollar amount at which an item must go on the capital rather than the operating budget? 4. Does the facility participate with a group to cooperatively purchase items? 5. Is there a Prime Vendor? If yes, how often is the contract renegotiated? 6. Is informal or open-market buying used for any items? Which ones? 7. Who orders…arrow_forwardCritical Incident Report- Dietary Mangement Critical incidences involve critical thinking and problem solving techniques. This exercise is the opportunity to analyze and decide on the appropriateness of the action and to determine better ways to solve problems, approach employees and get the job done. This exercise should help in doing it better the next time. As you observe or become more involved in the situations that require problem solving or critical thinking use this exercise to identify the what, who, and when and determine how the actions taken or not taken affected the outcome. You must write up two or more experiences. The summary is to include two parts: 1. Objective data of what occurred and how it occurred: 2. Analysis of what happened and what we could or would have done to make the outcome better.arrow_forward
 Practical Management ScienceOperations ManagementISBN:9781337406659Author:WINSTON, Wayne L.Publisher:Cengage,
 Foundations of Business (MindTap Course List)MarketingISBN:9781337386920Author:William M. Pride, Robert J. Hughes, Jack R. KapoorPublisher:Cengage Learning
 Foundations of Business - Standalone book (MindTa...MarketingISBN:9781285193946Author:William M. Pride, Robert J. Hughes, Jack R. KapoorPublisher:Cengage Learning