
Concept explainers
a)
To construct: A
Introduction: Quality is a measure of excellence or a state of being free from deficiencies, defects and important variations. It is obtained by consistent and strict commitment to certain standards to attain uniformity of a product to satisfy consumers’ requirement.
a)
Answer to Problem 12P
Explanation of Solution
Given information:
| Sample | Mean | Sample | Mean | Sample | Mean | Sample | Mean |
| 1 | 3.86 | 11 | 3.88 | 21 | 3.84 | 31 | 3.88 |
| 2 | 3.90 | 12 | 3.86 | 22 | 3.82 | 32 | 3.76 |
| 3 | 3.83 | 13 | 3.88 | 23 | 3.89 | 33 | 3.83 |
| 4 | 3.81 | 14 | 3.81 | 24 | 3.86 | 34 | 3.77 |
| 5 | 3.84 | 15 | 3.83 | 25 | 3.88 | x35 | 3.86 |
| 6 | 3.83 | 16 | 3.86 | 26 | 3.90 | 36 | 3.80 |
| 7 | 3.87 | 17 | 3.82 | 27 | 3.81 | 37 | 3.84 |
| 8 | 3.88 | 18 | 3.86 | 28 | 3.86 | 38 | 3.79 |
| 9 | 3.84 | 19 | 3.84 | 29 | 3.98 | 39 | 3.85 |
| 10 | 3.80 | 20 | 3.87 | 30 | 3.96 |
Formula:
Calculation of control limits and construction of
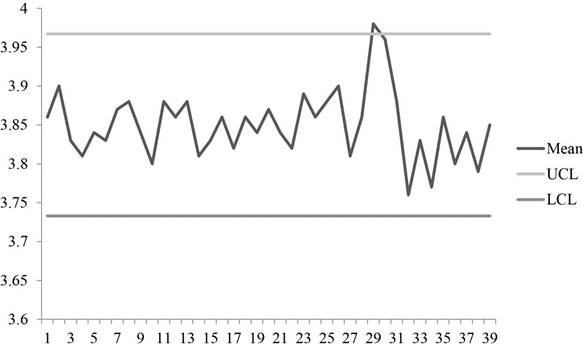
Graph shows the plot for sample means with UCL and LCL values. It can be observed that some points are above the control limits. So, the process is out of control.
Hence, the process is not in control.
b)
To analyze: The data using median run test and up and down run test and conclude the results.
Introduction: Quality is a measure of excellence or a state of being free from deficiencies, defects and important variations. It is obtained by consistent and strict commitment to certain standards to attain uniformity of a product to satisfy consumers’ requirement.
b)
Answer to Problem 12P
Explanation of Solution
Given information:
| Sample | Mean | Sample | Mean | Sample | Mean | Sample | Mean |
| 1 | 3.86 | 11 | 3.88 | 21 | 3.84 | 31 | 3.88 |
| 2 | 3.90 | 12 | 3.86 | 22 | 3.82 | 32 | 3.76 |
| 3 | 3.83 | 13 | 3.88 | 23 | 3.89 | 33 | 3.83 |
| 4 | 3.81 | 14 | 3.81 | 24 | 3.86 | 34 | 3.77 |
| 5 | 3.84 | 15 | 3.83 | 25 | 3.88 | x35 | 3.86 |
| 6 | 3.83 | 16 | 3.86 | 26 | 3.90 | 36 | 3.80 |
| 7 | 3.87 | 17 | 3.82 | 27 | 3.81 | 37 | 3.84 |
| 8 | 3.88 | 18 | 3.86 | 28 | 3.86 | 38 | 3.79 |
| 9 | 3.84 | 19 | 3.84 | 29 | 3.98 | 39 | 3.85 |
| 10 | 3.80 | 20 | 3.87 | 30 | 3.96 |
Formula:
Analysis of data:
To make analysis of data, the given data is compared with median 3.85 to make A/B and U/D.
| Sample | A/B | Mean | U/D | Sample | A/B | Mean | U/D |
| 1 | A | 3.86 | - | 21 | B | 3.84 | D |
| 2 | A | 3.90 | U | 22 | B | 3.82 | D |
| 3 | B | 3.83 | D | 23 | A | 3.89 | U |
| 4 | B | 3.81 | D | 24 | A | 3.86 | D |
| 5 | B | 3.84 | U | 25 | A | 3.88 | U |
| 6 | B | 3.83 | D | 26 | A | 3.90 | U |
| 7 | A | 3.87 | U | 27 | B | 3.81 | D |
| 8 | A | 3.88 | U | 28 | A | 3.86 | U |
| 9 | B | 3.84 | D | 29 | A | 3.98 | U |
| 10 | B | 3.80 | D | 30 | A | 3.96 | D |
| 11 | A | 3.88 | U | 31 | A | 3.88 | D |
| 12 | A | 3.86 | D | 32 | B | 3.76 | D |
| 13 | A | 3.88 | U | 33 | B | 3.83 | U |
| 14 | B | 3.81 | D | 34 | B | 3.77 | D |
| 15 | B | 3.83 | U | 35 | A | 3.86 | U |
| 16 | A | 3.86 | U | 36 | B | 3.80 | D |
| 17 | B | 3.82 | D | 37 | B | 3.84 | U |
| 18 | A | 3.86 | U | 38 | B | 3.79 | D |
| 19 | B | 3.84 | D | 39 | B | 3.85 | U |
| 20 | A | 3.87 | U |
Sample 39 ties with the median and in order to maximize the Ztest statistics, the sample 39 is labeled as B. Therefore, the observed number of runs is 18.
Median run test:
Calculation of expected number of runs:
The expected number of runs is calculated by adding half of the total number of samples with 1 which gives 20.5.
Calculation of standard deviation:
Standard deviation is calculated by subtracting number of sample 39 from 1 and dividing the resultant by 4 and taking square for the value which yields 3.08.
The z factor for median is calculated by dividing the difference of 18 and 20.5 with 3.08 which yields -0.81 which is within the test statistics of ±2.
Up/Down Test:
The observed number of runs from the analysis is 29.
Calculation of expected number of runs:
The expected number of runs is calculated by subtracting the double of the number of samples 39 and subtracting from1 and dividing the resultant with 3 which gives 25.7.
Calculation of standard deviation:
Standard deviation is calculated by multiplying the number of samples with 16 and subtracting the resultant from 29 and then dividing the resulting value with 90 and taking square root which yields 2.57.
The z factor for median is calculated by dividing the difference of 29 and 25.7 with 2.57 which yields +1.28 which is within the test statistics of ±2.
Hence, the results of the median run test and up/down test is random and no non randomness is detected.
Want to see more full solutions like this?
Chapter 10 Solutions
EBK OPERATIONS MANAGEMENT


- How can mindfulness be combined with cognitive reframing to build emotional regulation and mental flexibility? What is the strategy for maintaining mental well-being to improve through deliberate practice? How to engage in practices that help regulate emotions and build resilience?arrow_forward• We Are HIRING Salesforce Developer (2 - 4 Years) @ Cloudodyssey It Solutions Requirement : Appropriate knowledge on Salesforce standard objects Leads, Account, Contacts, Opportunity, Products, Lead process, Sales process, is required. • Hands-on experience in Salesforce Experience Cloud, Sales Cloud and Lightning. • • Hands experience with Salesforce development, administration, system integrations, Lightning Design System, and bug fixes. Experience in configuration, integration, APIs creation, testing and deployment of Salesforce.com functionality. Eloquent verbal and written communication skills. • Familiar with Agile framework. Work Location: Bangalore SUBMIT YOUR CV hello@cloudodyssey.coarrow_forwardAgree or disagree with post On the surface, the numbers in financial statements do present a snapshot of a company's financial position and performance. However, just looking at the raw numbers often doesn't tell the whole story or reveal underlying trends and relationships that are crucial for making informed decisions. Think of it like looking at individual pieces of a puzzle. Each number is a piece, providing some information. But to see the complete picture – the company's overall financial health, its performance over time, how it compares to its peers, and its potential future – you need to assemble those pieces using different analytical tools. For example: Horizontal analysis helps us understand how specific financial statement items have changed over multiple periods. Is revenue growing? Are expenses increasing at a faster rate than sales? This reveals trends that a single year's numbers wouldn't show. Vertical analysis allows us to see the relative size of each item within…arrow_forward
- What can you do in response to an insulting offer?arrow_forwardAgree or disagree with post If someone hits you with an insulting offer, the first thing to do is not take it personally. It’s normal to feel a little offended, but blowing up or shutting down won’t help your case. Better move is to stay calm and treat it like a misunderstanding or just the first step in the conversation. That way, you keep things respectful but still let them know the offer doesn’t sit right with you. It also helps to back up your response with facts. Bring in things like your experience, numbers, or any specific results you delivered. That can shift the conversation away from feelings and toward the value you bring. Agree or disagree with postarrow_forwardAgree or disagree with the post When you get an insulting offer, the best thing to do is stay calm and professional. Try not to take it personally or react out of anger. Instead, ask questions to understand why the offer was so low. This helps you get a better idea of what the other person is thinking. After that, you can respond with a counteroffer that shows your value. Use simple facts like your skills, experience, and what others in your field are getting paid to back up your request. If the person still refuses to offer something fair, it’s okay to politely say no and walk away. Standing up for yourself in a respectful way shows confidence and helps others take you seriously. Agree or disagree with the postarrow_forward
- Regarding perceptions that can occur when negotiating in different places and at different times, the continuation norm in e-negotiations is best described as _____. Group of answer choices A. negotiators' beliefs that negotiations are worth continuing B. the act of thinking about how things might have turned out differently C. the tendency for e-communicators to ascribe diabolical intentions to the other party D. the tendency for negotiators to behave as if they are communicating synchronously when in fact they are notarrow_forwardIn any discussion or meeting, there is a tendency for a minority of people to do most of the talking. A key determinant of who dominates the conversation is _____. Group of answer choices A. their status within the group B. their network of social connections C. their gender D. their agearrow_forwardWith regard to intergenerational negotiation, the _____ generation has vast numbers of relationships but few of them are deep. They spend more time communicating virtually than face-to-face. Their personal and work networks are vital to their on-the-fly learning and problem-solving skills. Armed with tools for working anywhere at any time, this generation puts more value in leading a balanced life and flexibility with their work and life demands. Group of answer choices A. mature B. boomer C. millennial D. Generation Xarrow_forward
- If a negotiator has less power than the counterparty and an unattractive BATNA, which communication medium might help the less-powerful negotiator claim more resources?arrow_forwardCould you help explain what the foundations of faith are? What are their strategies?arrow_forwardHi! Can you guys help me with this? Thank you! Please write-up summarizing the core message of the movie/documentary and the connection to the course material The documentary is Poisoned: The Dirty Truth About Your Food directed by Stephanie Soechtig from Netflix. * Here are the course material: Global Logistics Global Transportation; Global Inventory Management Global Operation Global Market Channels Purchasing Stategies: Outsourcing; Offshoring; Nearshoring; Multi-sourcing & Co-sourcing Make or Buy decisions Global Supply Chain Infrastructure: Transportation Infrastructure; Communication Infrastructure; Utilities Infrastructure; Technology Infrastructure Supply Chain Risks: • Supply Risks – disruption of supply, inventory and schedules. • Operational Risks – breakdown of operations, changes in technologies. • Demand Risks – variations in demand.• Security Risks – theft, sabotage, terrorism, counterfeiting.• Macro Risks – economic shifts, recession, wage hikes, varying…arrow_forward
 Practical Management ScienceOperations ManagementISBN:9781337406659Author:WINSTON, Wayne L.Publisher:Cengage,
 Foundations of Business (MindTap Course List)MarketingISBN:9781337386920Author:William M. Pride, Robert J. Hughes, Jack R. KapoorPublisher:Cengage Learning
 Foundations of Business - Standalone book (MindTa...MarketingISBN:9781285193946Author:William M. Pride, Robert J. Hughes, Jack R. KapoorPublisher:Cengage Learning