
Ten Lessons in Introductory Sociology
2nd Edition
ISBN: 9780190663872
Author: Kenneth A. Gould; Tammy L. Lewis
Publisher: Oxford University Press Academic US
expand_more
expand_more
format_list_bulleted
Videos
Textbook Question
Chapter 1, Problem 6SE
SECTION EXERCISES
The data in the Table 1A were collected from one of the authors’ statistics classes. The column heads give the variable, and each of the other rows represents a student in the class. Refer to this table for Exercises 1.1-1.10, 1.19 and 1.20.
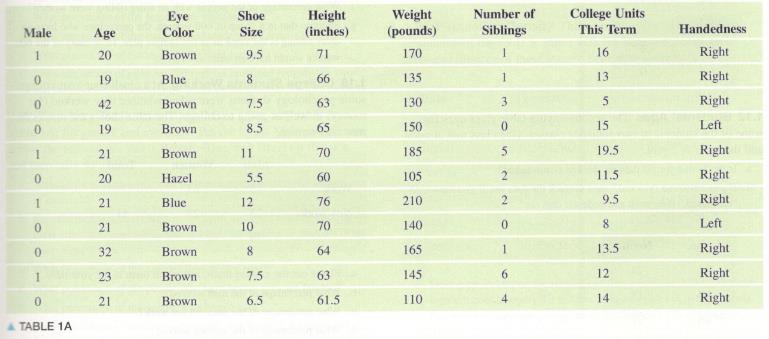
Give an example of another categorical variable we might have recorded for the students whose data are in Table 1A?
Expert Solution & Answer
Want to see the full answer?
Check out a sample textbook solution
Students have asked these similar questions
Show all work
Show all work
Show all work
Chapter 1 Solutions
Ten Lessons in Introductory Sociology
Ch. 1 - SECTION EXERCISES The data in the Table 1A were...Ch. 1 - SECTION EXERCISES The data in the Table 1A were...Ch. 1 - SECTION EXERCISES The data in the Table 1A were...Ch. 1 - SECTION EXERCISES The data in the Table 1A were...Ch. 1 - SECTION EXERCISES The data in the Table 1A were...Ch. 1 - SECTION EXERCISES The data in the Table 1A were...Ch. 1 - SECTION EXERCISES The data in the Table 1A were...Ch. 1 - SECTION EXERCISES The data in the Table 1A were...Ch. 1 - SECTION EXERCISES The data in the Table 1A were...Ch. 1 - SECTION EXERCISES The data in the Table 1A were...
Ch. 1 - SECTION EXERCISES Brain Size (Example 2) In 1991,...Ch. 1 - SECTION EXERCISES Students’ Ages The accompanying...Ch. 1 - Snacks Emmanuel, a student at a Los Angeles high...Ch. 1 - Movies A sample of students were questioned to...Ch. 1 - SECTION EXERCISES Older Siblings (Example 3) At a...Ch. 1 - SECTION EXERCISES College Students working at a...Ch. 1 - Finding and Using Percentages a. A statistics...Ch. 1 - Finding and Using Percentages a. A hospital...Ch. 1 - SECTION EXERCISES The data in the Table 1A were...Ch. 1 - SECTION EXERCISES The data in the Table 1A were...Ch. 1 - SECTION EXERCISES Two-Way Table from Data The...Ch. 1 - SECTION EXERCISES Two-way Table from Data Make a...Ch. 1 - SECTION EXERCISES Population Prediction The 2009...Ch. 1 - SECTION EXERCISES 2007 Population The 2009 World...Ch. 1 - Living with AIDS The table gives the number of...Ch. 1 - Population Density The accompanying table gives...Ch. 1 - Marriage rates the number of married people in the...Ch. 1 - Births and Deaths the following information about...Ch. 1 - Course Enrollment Rates (Example 5 ) two sections...Ch. 1 - Pedestrian fatalities In 2008, the National...Ch. 1 - Prob. 31SECh. 1 - Records of patients who have had broken ankles are...Ch. 1 - For Exercises 1.39 through 1.44, indicate whether...Ch. 1 - For Exercises 1.39 through 1.44, indicate whether...Ch. 1 - For Exercises 1.39 through 1.44, indicate whether...Ch. 1 - For Exercises 1.39 through 1.44, indicate whether...Ch. 1 - A researcher was interested in the effect of...Ch. 1 - A researcher was interested in the effect of...Ch. 1 - Effects of Tutoring on Math Grades (Example 8) A...Ch. 1 - Treating Depression A doctor who believes strongly...Ch. 1 - Early Tonsillectomy for Children (Example 6 )...Ch. 1 - Pneumonia Vaccine for Young Children A study...Ch. 1 - Copper Bracelets (Example 7 ) Some people believe...Ch. 1 - Weight Loss Study A group of overweight people are...Ch. 1 - Do Pesticides Cause Parkinson's Disease? A study...Ch. 1 - Breast Cancer Two drugs were tested to see whether...Ch. 1 - Flu Vaccine In the fall of 2004, there was a...Ch. 1 - Effect of Confederates on Compliance A study was...Ch. 1 - Vitamin C and Allergies (Example 8 ) Posted at the...Ch. 1 - Does Overeating Reduce Brain Function? The Harvard...Ch. 1 - Effects of Light Exposure (Example 9) A study...Ch. 1 - Scared Straight The idea of sending delinquents to...Ch. 1 - Obesity and Marital Status A 2009 study analyzed...Ch. 1 - Prob. 54CRECh. 1 - Probation a statistics student conducted a study...Ch. 1 - Scorpion Antivenom A study was done on children (6...Ch. 1 - Writing: Vitamin D Describe the design of a...Ch. 1 - Writing: Strokes People who have had strokes are...Ch. 1 - Medicaid Expansion Medicaid is a program...Ch. 1 - HIV-1 and HIV-2 Does infection with HIV-2 slow the...Ch. 1 - Death Row and Head Trauma A study conducted by...Ch. 1 - Brief Exercise and Diabetes As part of a study,...
Knowledge Booster


Learn more about
Need a deep-dive on the concept behind this application? Look no further. Learn more about this topic, statistics and related others by exploring similar questions and additional content below.Similar questions
- A marketing agency wants to determine whether different advertising platforms generate significantly different levels of customer engagement. The agency measures the average number of daily clicks on ads for three platforms: Social Media, Search Engines, and Email Campaigns. The agency collects data on daily clicks for each platform over a 10-day period and wants to test whether there is a statistically significant difference in the mean number of daily clicks among these platforms. Conduct ANOVA test. You can provide your answer by inserting a text box and the answer must include: also please provide a step by on getting the answers in excel Null hypothesis, Alternative hypothesis, Show answer (output table/summary table), and Conclusion based on the P value.arrow_forwardA company found that the daily sales revenue of its flagship product follows a normal distribution with a mean of $4500 and a standard deviation of $450. The company defines a "high-sales day" that is, any day with sales exceeding $4800. please provide a step by step on how to get the answers Q: What percentage of days can the company expect to have "high-sales days" or sales greater than $4800? Q: What is the sales revenue threshold for the bottom 10% of days? (please note that 10% refers to the probability/area under bell curve towards the lower tail of bell curve) Provide answers in the yellow cellsarrow_forwardBusiness Discussarrow_forward
- The following data represent total ventilation measured in liters of air per minute per square meter of body area for two independent (and randomly chosen) samples. Analyze these data using the appropriate non-parametric hypothesis testarrow_forwardeach column represents before & after measurements on the same individual. Analyze with the appropriate non-parametric hypothesis test for a paired design.arrow_forwardShould you be confident in applying your regression equation to estimate the heart rate of a python at 35°C? Why or why not?arrow_forward
arrow_back_ios
SEE MORE QUESTIONS
arrow_forward_ios
Recommended textbooks for you
 Holt Mcdougal Larson Pre-algebra: Student Edition...AlgebraISBN:9780547587776Author:HOLT MCDOUGALPublisher:HOLT MCDOUGAL
 Big Ideas Math A Bridge To Success Algebra 1: Stu...AlgebraISBN:9781680331141Author:HOUGHTON MIFFLIN HARCOURTPublisher:Houghton Mifflin Harcourt
 Glencoe Algebra 1, Student Edition, 9780079039897...AlgebraISBN:9780079039897Author:CarterPublisher:McGraw Hill
 Functions and Change: A Modeling Approach to Coll...AlgebraISBN:9781337111348Author:Bruce Crauder, Benny Evans, Alan NoellPublisher:Cengage Learning
Holt Mcdougal Larson Pre-algebra: Student Edition...
Algebra
ISBN:9780547587776
Author:HOLT MCDOUGAL
Publisher:HOLT MCDOUGAL
Big Ideas Math A Bridge To Success Algebra 1: Stu...
Algebra
ISBN:9781680331141
Author:HOUGHTON MIFFLIN HARCOURT
Publisher:Houghton Mifflin Harcourt
Glencoe Algebra 1, Student Edition, 9780079039897...
Algebra
ISBN:9780079039897
Author:Carter
Publisher:McGraw Hill
Functions and Change: A Modeling Approach to Coll...
Algebra
ISBN:9781337111348
Author:Bruce Crauder, Benny Evans, Alan Noell
Publisher:Cengage Learning
How to make Frequency Distribution Table / Tally Marks and Frequency Distribution Table; Author: Reenu Math;https://www.youtube.com/watch?v=i_A6RiE8tLE;License: Standard YouTube License, CC-BY
Frequency distribution table in statistics; Author: Math and Science;https://www.youtube.com/watch?v=T7KYO76DoOE;License: Standard YouTube License, CC-BY
Frequency Distribution Table for Grouped/Continuous data | Math Dot Com; Author: Maths dotcom;https://www.youtube.com/watch?v=ErnccbXQOPY;License: Standard Youtube License