
Ten Lessons in Introductory Sociology
2nd Edition
ISBN: 9780190663872
Author: Kenneth A. Gould; Tammy L. Lewis
Publisher: Oxford University Press Academic US
expand_more
expand_more
format_list_bulleted
Concept explainers
Videos
Textbook Question
Chapter 1, Problem 2SE
SECTION EXERCISES
The data in the Table 1A were collected from one of the authors’ statistics classes. The column heads give the variable, and each of the other rows represents a student in the class. Refer to this table for Exercises 1.1-1.10, 1.19 and 1.20.
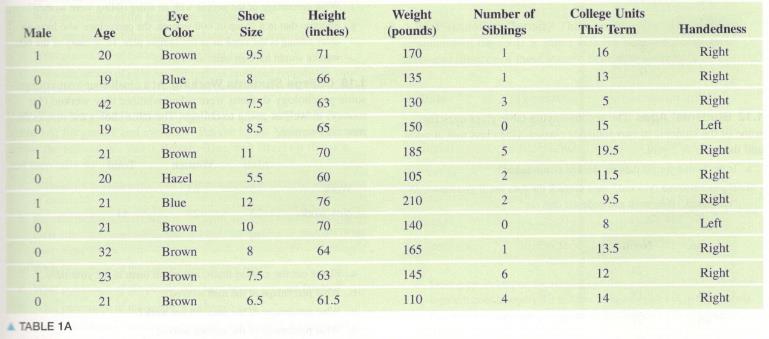
People In Table 1A, there are observations on how many people?
Expert Solution & Answer
Want to see the full answer?
Check out a sample textbook solution
Students have asked these similar questions
https://www.hawkeslearning.com/Statistics/dbs2/datasets.html
NC Current Students - North Ce X | NC Canvas Login Links - North ( X
Final Exam Comprehensive x Cengage Learning
x
WASTAT - Final Exam - STAT
→
C
webassign.net/web/Student/Assignment-Responses/submit?dep=36055360&tags=autosave#question3659890_9
Part (b)
Draw a scatter plot of the ordered pairs.
N
Life
Expectancy
Life
Expectancy
80
70
600
50
40
30
20
10
Year of
1950
1970 1990
2010 Birth
O
Life
Expectancy
Part (c)
800
70
60
50
40
30
20
10
1950
1970 1990
W
ALT
林
$
#
4
R
J7
Year of
2010 Birth
F6
4+
80
70
60
50
40
30
20
10
Year of
1950 1970 1990
2010 Birth
Life
Expectancy
Ox
800
70
60
50
40
30
20
10
Year of
1950 1970 1990 2010 Birth
hp
P.B.
KA
&
7
80
% 5
H
A
B
F10
711
N
M
K
744
PRT SC
ALT
CTRL
Harvard University
California Institute of Technology
Massachusetts Institute of Technology
Stanford University
Princeton University
University of Cambridge
University of Oxford
University of California, Berkeley
Imperial College London
Yale University
University of California, Los Angeles
University of Chicago
Johns Hopkins University
Cornell University
ETH Zurich
University of Michigan
University of Toronto
Columbia University
University of Pennsylvania
Carnegie Mellon University
University of Hong Kong
University College London
University of Washington
Duke University
Northwestern University
University of Tokyo
Georgia Institute of Technology
Pohang University of Science and Technology
University of California, Santa Barbara
University of British Columbia
University of North Carolina at Chapel Hill
University of California, San Diego
University of Illinois at Urbana-Champaign
National University of Singapore
McGill…
Chapter 1 Solutions
Ten Lessons in Introductory Sociology
Ch. 1 - SECTION EXERCISES The data in the Table 1A were...Ch. 1 - SECTION EXERCISES The data in the Table 1A were...Ch. 1 - SECTION EXERCISES The data in the Table 1A were...Ch. 1 - SECTION EXERCISES The data in the Table 1A were...Ch. 1 - SECTION EXERCISES The data in the Table 1A were...Ch. 1 - SECTION EXERCISES The data in the Table 1A were...Ch. 1 - SECTION EXERCISES The data in the Table 1A were...Ch. 1 - SECTION EXERCISES The data in the Table 1A were...Ch. 1 - SECTION EXERCISES The data in the Table 1A were...Ch. 1 - SECTION EXERCISES The data in the Table 1A were...
Ch. 1 - SECTION EXERCISES Brain Size (Example 2) In 1991,...Ch. 1 - SECTION EXERCISES Students’ Ages The accompanying...Ch. 1 - Snacks Emmanuel, a student at a Los Angeles high...Ch. 1 - Movies A sample of students were questioned to...Ch. 1 - SECTION EXERCISES Older Siblings (Example 3) At a...Ch. 1 - SECTION EXERCISES College Students working at a...Ch. 1 - Finding and Using Percentages a. A statistics...Ch. 1 - Finding and Using Percentages a. A hospital...Ch. 1 - SECTION EXERCISES The data in the Table 1A were...Ch. 1 - SECTION EXERCISES The data in the Table 1A were...Ch. 1 - SECTION EXERCISES Two-Way Table from Data The...Ch. 1 - SECTION EXERCISES Two-way Table from Data Make a...Ch. 1 - SECTION EXERCISES Population Prediction The 2009...Ch. 1 - SECTION EXERCISES 2007 Population The 2009 World...Ch. 1 - Living with AIDS The table gives the number of...Ch. 1 - Population Density The accompanying table gives...Ch. 1 - Marriage rates the number of married people in the...Ch. 1 - Births and Deaths the following information about...Ch. 1 - Course Enrollment Rates (Example 5 ) two sections...Ch. 1 - Pedestrian fatalities In 2008, the National...Ch. 1 - Prob. 31SECh. 1 - Records of patients who have had broken ankles are...Ch. 1 - For Exercises 1.39 through 1.44, indicate whether...Ch. 1 - For Exercises 1.39 through 1.44, indicate whether...Ch. 1 - For Exercises 1.39 through 1.44, indicate whether...Ch. 1 - For Exercises 1.39 through 1.44, indicate whether...Ch. 1 - A researcher was interested in the effect of...Ch. 1 - A researcher was interested in the effect of...Ch. 1 - Effects of Tutoring on Math Grades (Example 8) A...Ch. 1 - Treating Depression A doctor who believes strongly...Ch. 1 - Early Tonsillectomy for Children (Example 6 )...Ch. 1 - Pneumonia Vaccine for Young Children A study...Ch. 1 - Copper Bracelets (Example 7 ) Some people believe...Ch. 1 - Weight Loss Study A group of overweight people are...Ch. 1 - Do Pesticides Cause Parkinson's Disease? A study...Ch. 1 - Breast Cancer Two drugs were tested to see whether...Ch. 1 - Flu Vaccine In the fall of 2004, there was a...Ch. 1 - Effect of Confederates on Compliance A study was...Ch. 1 - Vitamin C and Allergies (Example 8 ) Posted at the...Ch. 1 - Does Overeating Reduce Brain Function? The Harvard...Ch. 1 - Effects of Light Exposure (Example 9) A study...Ch. 1 - Scared Straight The idea of sending delinquents to...Ch. 1 - Obesity and Marital Status A 2009 study analyzed...Ch. 1 - Prob. 54CRECh. 1 - Probation a statistics student conducted a study...Ch. 1 - Scorpion Antivenom A study was done on children (6...Ch. 1 - Writing: Vitamin D Describe the design of a...Ch. 1 - Writing: Strokes People who have had strokes are...Ch. 1 - Medicaid Expansion Medicaid is a program...Ch. 1 - HIV-1 and HIV-2 Does infection with HIV-2 slow the...Ch. 1 - Death Row and Head Trauma A study conducted by...Ch. 1 - Brief Exercise and Diabetes As part of a study,...
Knowledge Booster


Learn more about
Need a deep-dive on the concept behind this application? Look no further. Learn more about this topic, statistics and related others by exploring similar questions and additional content below.Similar questions
- Name Harvard University California Institute of Technology Massachusetts Institute of Technology Stanford University Princeton University University of Cambridge University of Oxford University of California, Berkeley Imperial College London Yale University University of California, Los Angeles University of Chicago Johns Hopkins University Cornell University ETH Zurich University of Michigan University of Toronto Columbia University University of Pennsylvania Carnegie Mellon University University of Hong Kong University College London University of Washington Duke University Northwestern University University of Tokyo Georgia Institute of Technology Pohang University of Science and Technology University of California, Santa Barbara University of British Columbia University of North Carolina at Chapel Hill University of California, San Diego University of Illinois at Urbana-Champaign National University of Singapore…arrow_forwardA company found that the daily sales revenue of its flagship product follows a normal distribution with a mean of $4500 and a standard deviation of $450. The company defines a "high-sales day" that is, any day with sales exceeding $4800. please provide a step by step on how to get the answers in excel Q: What percentage of days can the company expect to have "high-sales days" or sales greater than $4800? Q: What is the sales revenue threshold for the bottom 10% of days? (please note that 10% refers to the probability/area under bell curve towards the lower tail of bell curve) Provide answers in the yellow cellsarrow_forwardFind the critical value for a left-tailed test using the F distribution with a 0.025, degrees of freedom in the numerator=12, and degrees of freedom in the denominator = 50. A portion of the table of critical values of the F-distribution is provided. Click the icon to view the partial table of critical values of the F-distribution. What is the critical value? (Round to two decimal places as needed.)arrow_forward
- A retail store manager claims that the average daily sales of the store are $1,500. You aim to test whether the actual average daily sales differ significantly from this claimed value. You can provide your answer by inserting a text box and the answer must include: Null hypothesis, Alternative hypothesis, Show answer (output table/summary table), and Conclusion based on the P value. Showing the calculation is a must. If calculation is missing,so please provide a step by step on the answers Numerical answers in the yellow cellsarrow_forwardShow all workarrow_forwardShow all workarrow_forward
arrow_back_ios
SEE MORE QUESTIONS
arrow_forward_ios
Recommended textbooks for you
 Holt Mcdougal Larson Pre-algebra: Student Edition...AlgebraISBN:9780547587776Author:HOLT MCDOUGALPublisher:HOLT MCDOUGAL
 Glencoe Algebra 1, Student Edition, 9780079039897...AlgebraISBN:9780079039897Author:CarterPublisher:McGraw Hill
 Big Ideas Math A Bridge To Success Algebra 1: Stu...AlgebraISBN:9781680331141Author:HOUGHTON MIFFLIN HARCOURTPublisher:Houghton Mifflin Harcourt
 Functions and Change: A Modeling Approach to Coll...AlgebraISBN:9781337111348Author:Bruce Crauder, Benny Evans, Alan NoellPublisher:Cengage Learning
Holt Mcdougal Larson Pre-algebra: Student Edition...
Algebra
ISBN:9780547587776
Author:HOLT MCDOUGAL
Publisher:HOLT MCDOUGAL
Glencoe Algebra 1, Student Edition, 9780079039897...
Algebra
ISBN:9780079039897
Author:Carter
Publisher:McGraw Hill
Big Ideas Math A Bridge To Success Algebra 1: Stu...
Algebra
ISBN:9781680331141
Author:HOUGHTON MIFFLIN HARCOURT
Publisher:Houghton Mifflin Harcourt
Functions and Change: A Modeling Approach to Coll...
Algebra
ISBN:9781337111348
Author:Bruce Crauder, Benny Evans, Alan Noell
Publisher:Cengage Learning
The Shape of Data: Distributions: Crash Course Statistics #7; Author: CrashCourse;https://www.youtube.com/watch?v=bPFNxD3Yg6U;License: Standard YouTube License, CC-BY
Shape, Center, and Spread - Module 20.2 (Part 1); Author: Mrmathblog;https://www.youtube.com/watch?v=COaid7O_Gag;License: Standard YouTube License, CC-BY
Shape, Center and Spread; Author: Emily Murdock;https://www.youtube.com/watch?v=_YyW0DSCzpM;License: Standard Youtube License