
Concept explainers
To determine the concentration of a purified protein sample, a graduate student used spectrophotometery to measure the absorbance given in the table below:
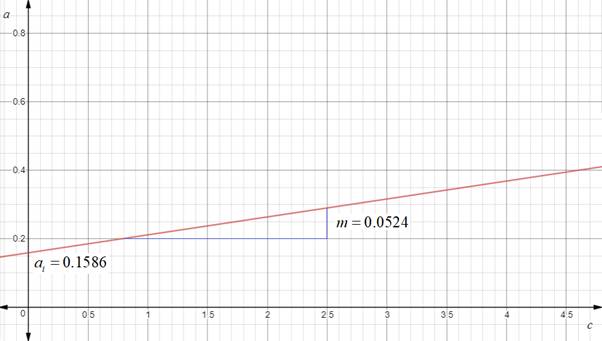
The absorbance of the sample, in is the rate of change of absorbance a with respect to concentration c, and a1 is the y -intercept.
(a) Find the equation of the line that describes the concentration absorbance relationship for this protein and determine the slope in of the linear relationship.
(b) Using the equation of the line from part (a). Find the concentration of the sample if this sample had absorption of 0.486.
(c) If the sample is diluted to a concentration of 0.00419 µg/ml, what would you expect the absorption to he? Would this value he accurate?
(d) Sketch the graph of absorbance a as a function of concentration c and clearly indicate both the slope in and the y -intercept.
Want to see the full answer?
Check out a sample textbook solutionChapter 1 Solutions
Introductory Mathematics for Engineering Applications
Additional Math Textbook Solutions
University Calculus: Early Transcendentals (4th Edition)
Elementary Statistics
Calculus for Business, Economics, Life Sciences, and Social Sciences (14th Edition)
College Algebra (7th Edition)
Elementary Statistics (13th Edition)
- Tsunami Waves and BreakwatersThis is a continuation of Exercise 16. Breakwaters affect wave height by reducing energy. See Figure 5.30. If a tsunami wave of height H in a channel of width W encounters a breakwater that narrows the channel to a width w, then the height h of the wave beyond the breakwater is given by h=HR0.5, where R is the width ratio R=w/W. a. Suppose a wave of height 8 feet in a channel of width 5000feet encounters a breakwater that narrows the channel to 3000feet. What is the height of the wave beyond the breakwater? b. If a channel width is cut in half by a breakwater, what is the effect on wave height? 16. Height of Tsunami WavesWhen waves generated by tsunamis approach shore, the height of the waves generally increases. Understanding the factors that contribute to this increase can aid in controlling potential damage to areas at risk. Greens law tells how water depth affects the height of a tsunami wave. If a tsunami wave has height H at an ocean depth D, and the wave travels to a location with water depth d, then the new height h of the wave is given by h=HR0.25, where R is the water depth ratio given by R=D/d. a. Calculate the height of a tsunami wave in water 25feet deep if its height is 3feet at its point of origin in water 15,000feet deep. b. If water depth decreases by half, the depth ratio R is doubled. How is the height of the tsunami wave affected?arrow_forwardFind the intensities of earthquakes whose magnitudes are (a) R=6.0 and (b) R=7.9.arrow_forwardPlease Explain results. Thank youarrow_forward
- Please fill in the blanks.arrow_forward5 Launch Meeting - Zoom .com/presentation?pin=JE9RQ X Year 1965 Enrollment 650 Nearpod -3.05 Re-expressing D X The following data represent the Woodward Academy Upper School enrollment during a 35-year period |r= LSRL equation : 1970 690 Tt i H O 1975 ONearpod -3.05 Re-expressing Da X 740 1980 790 1985 Open navigator A 840 YOUR TURN O 1990 Nearpod -3.05 Re-expressing Da X 900 1995 960 2000 1025 |||| + Submitarrow_forwardThe efficiency for a steel specimen immersed in a phosphating tank is the weight of the phosphate coating divided by the metal loss (both in mg/ft2). An article gave the accompanying data on tank temperature (x) and efficiency ratio (y). Temp. 171 Ratio y = Ratio Temp. 181 181 173 Ratio 0.76 1.35 1.44 Temp. 183 183 174 1.53 1.58 1.69 USE SALT 181 175 1.09 181 175 176 1.05 1.18 181 182 177 183 185 185 186 0.98 182 2.11 2.19 0.92 1.45 187 1.71 1.98 2.62 1.43 2.56 2.96 1.95 178 1.88 183 1.00 189 3.14 (a) Determine the equation of the estimated regression line. (Round all numerical values to four decimal places.) (b) Calculate a point estimate for true average efficiency ratio when tank temperature is 183. (Round your answer to four decimal places.) (c) Calculate the values of the residuals from the least squares line for the four observations for which temperature is 183. (Round your answers to two decimal places.) (183, 1.00) (183, 1.71) (183, 1.98) (183, 2.62) Why do they not all have…arrow_forward
- An existing urban freeway with 4 lanes in each direction has the following characteristics. Traffic data: Peak hour volume (in the peak direction): Trucks: PHF = 0.92 Geometric data: Lane width: Shoulder width: Total ramp density: Terrain: rolling 11 ft 6 ft 1.8 ramps per mile 7,210 veh/h 10% of peak hour volume Determine the LOS in the peak hour. (Assume commuter traffic and assume no RVs.) O LOS A O LOS B O LOS C O LOS D O LOS E O LOS F Show the demand flow rate (in pc/h/In), mean speed (in mi/h), and density (in pc/mi/In) for the given conditions. demand flow rate mean speed density pc/h/In mi/h pc/mi/Inarrow_forwardAn unknown metal has been found and the following experimental results have been tabulated in the table below. The table contains the grams of the unknown metal and the volume in milliliters of water displacement. Find a linear model that expresses mass as a function of the volume. grams Volume in ml 15 289.8 17.5 331.3 nces 20 386.4 22.5 426 ations 487.8 25 27.5 520.7 Drive 30 591.2 365 A) Write the linear regression equation for the data in the chart. t Course tions Volume = where x is the grams of the unknown metal. Round your answers to 3 decimal places B) If the mass of an unknown metal is 13, using your un-rounded regression equation find its predicted volume. Round your answer to 1 decimal place. Question Help: O Message instructor Submit Question Type here to search B Narrow_forwardThe efficiency for a steel specimen immersed in a phosphating tank is the weight of the phosphate coating divided by the metal loss (both in mg/ft). An article gave the accompanying data on tank temperature (x) and efficiency ratio (y). Temp. 171 173 174 175 175 176 177 178 Ratio 0.86 1.29 1.40 1.05 1.01 1.04 0.94 1.78 Temp. 181 181 181 181 181 182 182 183 Ratio 1.41 1.56 1.63 2.03 2.07 0.76 1.47 0.84 Temp. 183 183 183 185 185 186 187 189 Ratio 1.75 1.92 2.64 1.39 2.58 2.90 1.81 3.16 In USE SALT (a) Determine the equation of the estimated regression line. (Round all numerical values to four decimal places.) y = -15.3081 + 0.0939x (b) Calculate a point estimate for true average efficiency ratio when tank temperature is 183. (Round your answer to four decimal places.) 1.8756 (c) Calculate the values of the residuals from the least squares line for the four observations for which temperature is 183. (Round your answers to two decimal places.) (183, 0.84) |-1.03 (183, 1.75) |-0.12 (183,…arrow_forward
- Medical researchers tested a new method of typing blood using low-cost paper. The researchers applied blood drops to the paper and recorded the rate of absorption (called blood wicking). The table gives the wicking lengths (millimeters) for six blood drops, each at a different antibody concentration. Let y = wicking length and x = antibody concentration. Droplet Length Concentration 1 22.50 0.0 2 16.00 0.2 3 13.50 0.4 14.00 0.6 5 13.75 0.8 6 12.50 1.0 (1) Give the equation of the fitted regression model. b1: (Round off to 4 decimal places) bo: (Round off to 4 decimal places) (2) Test the hypothesis that the Bo = 20 versus Bo < 20 using a=0.1. Test Statistic (Round off to 2 decimal places): Conclusion: (Type 'Reject HO' or 'Fail to Reject HO') (3) Construct the ANOVA table to test Bo = 0 versus Bo + 0 using a=0.05. (Show in Solution) (4) Find the coefficient of determination. (Round off to 4 decimal places)arrow_forwardThe efficiency for a steel specimen immersed in a phosphating tank is the weight of the phosphate coating divided by the metal loss (both in mg/ft2). An article gave the accompanying data on tank temperature (x) and efficiency ratio (y). Temp. Ratio Ratio 173 Temp. 183 0.76 Ratio 175 1.29 1.38 183 Temp. 185 185 176 USE SALT 183 185 1.87 2.04 2.70 177 1.51 1.70 1.65 2.21 2.07 0.99 X 177 183 183 187 1.01 0.98 178 187 184 179 188 1.06 184 0.74 1.47 189 180 1.82 185 0.92 191 1.59 2.42 2.92 1.95 3.14 (a) Determine the equation of the estimated regression line. (Round all numerical values to four decimal places.) y = 16.6666 + 0.1005x I X ÷ VO mathPa Operatio Function Symbols Relation Setsarrow_forwardThe efficiency for a steel specimen immersed in a phosphating tank is the weight of the phosphate coating divided by the metal loss (both in mg/ft²). An article gave the accompanying data on tank temperature (x) and efficiency ratio (y). Temp. 173 y = Ratio Temp. 183 Ratio 175 176 Ratio 183 183 1.47 1.70 1.67 177 177 0.88 1.37 1.40 0.97 1.09 0.98 1.00 1.70 183 183 2.15 Temp. 185 185 185 187 2.11 178 187 184 179 0.90 184 180 1.53 185 0.80 188 189 191 1.89 1.98 2.74 1.51 2.56 3.02 1.77 3.16 (a) Determine the equation of the estimated regression line. (Round all numerical values to four decimal places.) (b) Calculate a point estimate for true average efficiency ratio when tank temperature is 185. (Round your answer to four decimal places.) (c) Calculate the values of the residuals from the least squares line for the four observations for which temperature is 185. (Round your answers to two decimal places.) (185, 0.80) (185, 1.89) (185, 1.98) (185, 2.74) Why do they not all have the same…arrow_forward
- Algebra: Structure And Method, Book 1AlgebraISBN:9780395977224Author:Richard G. Brown, Mary P. Dolciani, Robert H. Sorgenfrey, William L. ColePublisher:McDougal LittellAlgebra & Trigonometry with Analytic GeometryAlgebraISBN:9781133382119Author:SwokowskiPublisher:CengageBig Ideas Math A Bridge To Success Algebra 1: Stu...AlgebraISBN:9781680331141Author:HOUGHTON MIFFLIN HARCOURTPublisher:Houghton Mifflin Harcourt
- Glencoe Algebra 1, Student Edition, 9780079039897...AlgebraISBN:9780079039897Author:CarterPublisher:McGraw HillFunctions and Change: A Modeling Approach to Coll...AlgebraISBN:9781337111348Author:Bruce Crauder, Benny Evans, Alan NoellPublisher:Cengage Learning