Introductory Mathematics for Engineering Applications
1st Edition
ISBN: 9781118141809
Author: Nathan Klingbeil
Publisher: WILEY
expand_more
expand_more
format_list_bulleted
Concept explainers
Textbook Question
Chapter 1, Problem 26P
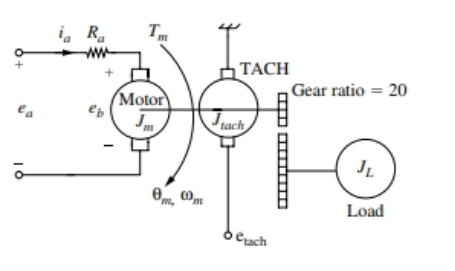
Repeat problem P1-25 for the data shown in Fig. P1.26.

Expert Solution & Answer
Want to see the full answer?
Check out a sample textbook solution
Students have asked these similar questions
Ju
at
© Ju
370
= x (-
пье
zxp
= c² (2² 4 )
dx²
ахе
2
nze
dyz
t
nzp
Q/what type of partial differential equation (PDE)
are the following-
Q
Calculate the Fourier series for
f(x) = x
on
the interval -16≤x≤ T
Find all positive integers n
such that n.2n +1 is a square.
Chapter 1 Solutions
Introductory Mathematics for Engineering Applications
Ch. 1 - A constant force F=2N is applied to a spring and...Ch. 1 - The spring force F and displacement x for a...Ch. 1 - The spring force F and displacement x for a...Ch. 1 - In a bolted connection shown in Fig. P1.4. the...Ch. 1 - Repeat problem P1.14 for the data given in Fig...Ch. 1 - The velocity v (t ) of a ball thrown upward...Ch. 1 - The velocity v (r ) of a ball thrown upward...Ch. 1 - A model rocket is fired in the vertical plane. The...Ch. 1 - A model rocket is fired in the vertical plane. The...Ch. 1 - The velocity of a vehicle is measured at two...
Ch. 1 - The velocity of a vehicle is measured at two...Ch. 1 - The velocity v (t ) of a vehicle during braking is...Ch. 1 - A linear trajectory is planned for a robot to pick...Ch. 1 - The acceleration of the linear trajectory of...Ch. 1 - The temperature distribution in a well-insulated...Ch. 1 - The temperature distribution in a well-insulated...Ch. 1 - The voltage-current relatonship for the cicuit...Ch. 1 - A voltage source Vs is used to apply two different...Ch. 1 - Repeat problem P1-18 for the data shown in Fig,...Ch. 1 - Repeat problem P1-18 for the data shown in Fig...Ch. 1 - A linear model of a diode is shown in Fig. P1.21....Ch. 1 - Repeat Problem P1-21 for the data given in Fig....Ch. 1 - The output voltage, v0, of the Op-Amp circuit...Ch. 1 - The output voltage, v0, of the Op-Amp circuit...Ch. 1 - A DC motor is driving an inertial load JL shown in...Ch. 1 - Repeat problem P1-25 for the data shown in Fig....Ch. 1 - In the active region, the output voltage v0 of the...Ch. 1 - Repeat problem P1-27 for the data given in Fig,...Ch. 1 - An actuator used in a prosthetic arm can produce...Ch. 1 - The following two measurements of maximum heart...Ch. 1 - The electrical activity of muscles can he...Ch. 1 - A civil engineer needs to establish the elevation...Ch. 1 - A thermocouple is a temperature measurement...Ch. 1 - The voltage across a thermocouple is calibrated...Ch. 1 - An iron-constantan thermocouple is calibrated by...Ch. 1 - Prob. 36PCh. 1 - Repeat problem P1-36 for the data shown in Fig....Ch. 1 - To determine the concentration of a purified...Ch. 1 - Repeat problem P1-38 lithe absorption-...Ch. 1 - A chemistry student is performing in experiment to...Ch. 1 - To obtain the linear relationship between the...Ch. 1 - A thermostat control with dial marking from 0 to...Ch. 1 - In a pressure-fed journal bearing, forced cooling...
Additional Math Textbook Solutions
Find more solutions based on key concepts
Assessment 1-1A The following is a magic square all rows, columns, and diagonals sum to the same number. Find t...
A Problem Solving Approach To Mathematics For Elementary School Teachers (13th Edition)
In Exercises 3–8, find the limit of each function (a) as, and (b) as . (You may wish to visualize your answer ...
University Calculus: Early Transcendentals (4th Edition)
Identify f as being linear, quadratic, or neither. If f is quadratic, identify the leading coefficient a and ...
College Algebra with Modeling & Visualization (5th Edition)
Identifying H0 and H1. In Exercises 5–8, do the following:
a. Express the original claim in symbolic form.
b. I...
Elementary Statistics (13th Edition)
CHECK POINT I You deposit $3000 in s savings account at Yourtown Bank, which has rate of 5%. Find the interest ...
Thinking Mathematically (6th Edition)
Knowledge Booster
Learn more about
Need a deep-dive on the concept behind this application? Look no further. Learn more about this topic, advanced-math and related others by exploring similar questions and additional content below.Similar questions
- A straight-line H is tangent to the function g(x)=-6x-3+ 8 and passes through the point (- 4,7). Determine, the gradient of the straight-line Choose.... y-intercept of the straight-line Choose... + which of the following is the answers -1.125 -6.72 1.125 7.28 0.07 - 7.28 6.72arrow_forwardYou are required to match the correct response to each statement provided. Another term/word that can be used synonymously to Choose... gradient. A term/phrase that is associated with Arithmetic Progression. Common difference → An identity matrix can be referred to as a Choose... ÷ What is the inequality sign that represents "at most"? VIarrow_forwardAffect of sports on students linked with physical problemsarrow_forward
- 26.1. Locate and determine the order of zeros of the following functions: (a). e2z – e*, (b). z2sinhz, (c). z*cos2z, (d). z3 cosz2.arrow_forwardQ/ show that: The function feal = Se²²²+d+ is analyticarrow_forwardComplex Analysis 2 First exam Q1: Evaluate f the Figure. 23+3 z(z-i)² 2024-2025 dz, where C is the figure-eight contour shown in C₂arrow_forward
- Q/ Find the Laurent series of (2-3) cos around z = 1 2-1arrow_forward31.5. Let be the circle |+1| = 2 traversed twice in the clockwise direction. Evaluate dz (22 + 2)²arrow_forwardUsing FDF, BDF, and CDF, find the first derivative; 1. The distance x of a runner from a fixed point is measured (in meters) at an interval of half a second. The data obtained is: t 0 x 0 0.5 3.65 1.0 1.5 2.0 6.80 9.90 12.15 Use CDF to approximate the runner's velocity at times t = 0.5s and t = 1.5s 2. Using FDF, BDF, and CDF, find the first derivative of f(x)=x Inx for an input of 2 assuming a step size of 1. Calculate using Analytical Solution and Absolute Relative Error: = True Value - Approximate Value| x100 True Value 3. Given the data below where f(x) sin (3x), estimate f(1.5) using Langrage Interpolation. x 1 1.3 1.6 1.9 2.2 f(x) 0.14 -0.69 -0.99 -0.55 0.31 4. The vertical distance covered by a rocket from t=8 to t=30 seconds is given by: 30 x = Loo (2000ln 140000 140000 - 2100 9.8t) dt Using the Trapezoidal Rule, n=2, find the distance covered. 5. Use Simpson's 1/3 and 3/8 Rule to approximate for sin x dx. Compare the results for n=4 and n=8arrow_forward
- 1. A Blue Whale's resting heart rate has period that happens to be approximately equal to 2π. A typical ECG of a whale's heartbeat over one period may be approximated by the function, f(x) = 0.005x4 2 0.005x³-0.364x² + 1.27x on the interval [0, 27]. Find an nth-order Fourier approximation to the Blue Whale's heartbeat, where n ≥ 3 is different from that used in any other posts on this topic, to generate a periodic function that can be used to model its heartbeat, and graph your result. Be sure to include your chosen value of n in your Subject Heading.arrow_forward7. The demand for a product, in dollars, is p = D(x) = 1000 -0.5 -0.0002x² 1 Find the consumer surplus when the sales level is 200. [Hints: Let pm be the market price when xm units of product are sold. Then the consumer surplus can be calculated by foam (D(x) — pm) dx]arrow_forward4. Find the general solution and the definite solution for the following differential equations: (a) +10y=15, y(0) = 0; (b) 2 + 4y = 6, y(0) =arrow_forward
arrow_back_ios
SEE MORE QUESTIONS
arrow_forward_ios
Recommended textbooks for you
 Functions and Change: A Modeling Approach to Coll...AlgebraISBN:9781337111348Author:Bruce Crauder, Benny Evans, Alan NoellPublisher:Cengage Learning
 Linear Algebra: A Modern IntroductionAlgebraISBN:9781285463247Author:David PoolePublisher:Cengage Learning
 Trigonometry (MindTap Course List)TrigonometryISBN:9781337278461Author:Ron LarsonPublisher:Cengage Learning
 College AlgebraAlgebraISBN:9781305115545Author:James Stewart, Lothar Redlin, Saleem WatsonPublisher:Cengage Learning
 Algebra and Trigonometry (MindTap Course List)AlgebraISBN:9781305071742Author:James Stewart, Lothar Redlin, Saleem WatsonPublisher:Cengage Learning

Functions and Change: A Modeling Approach to Coll...
Algebra
ISBN:9781337111348
Author:Bruce Crauder, Benny Evans, Alan Noell
Publisher:Cengage Learning

Linear Algebra: A Modern Introduction
Algebra
ISBN:9781285463247
Author:David Poole
Publisher:Cengage Learning

Trigonometry (MindTap Course List)
Trigonometry
ISBN:9781337278461
Author:Ron Larson
Publisher:Cengage Learning


College Algebra
Algebra
ISBN:9781305115545
Author:James Stewart, Lothar Redlin, Saleem Watson
Publisher:Cengage Learning

Algebra and Trigonometry (MindTap Course List)
Algebra
ISBN:9781305071742
Author:James Stewart, Lothar Redlin, Saleem Watson
Publisher:Cengage Learning
Finding Local Maxima and Minima by Differentiation; Author: Professor Dave Explains;https://www.youtube.com/watch?v=pvLj1s7SOtk;License: Standard YouTube License, CC-BY