Concept explainers
Sketching the Graph of an Equation In Exercises 1 and 2, construct a table of values that consists of several solution points of the equation. Use the resulting solution points to sketch the graph of the equation.
To graph: The equation
Explanation of Solution
Graph:
Consider the equation,
To find the different solution point, find the values of
For
The solution point is
For
The solution point is
For
The solution point is
For
The solution point is
For
The solution point is
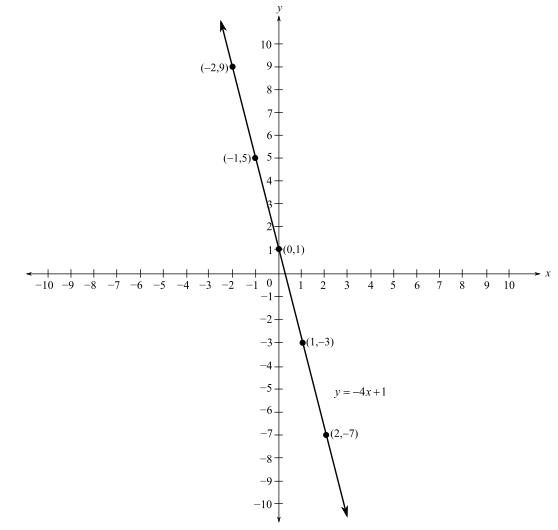
The table given below shows the solution points of the equation
Now, plot the points from the table and pass a line through them.
The figure given below shows the graph of the equation

From the graph, it can be observed that the equation forms a straight line and the solution points lie on the line.
Want to see more full solutions like this?
Chapter 1 Solutions
College Algebra
- In simplest terms and step by step For each quadratic relation, find the zeros and the maximum or minimum. 1) y = - 2 x2 - 28 x + 64 2) y = 6 x2 + 36 x - 42arrow_forwardWrite each relation in standard form a)y = 5(x + 10)2 + 7 b)y = 9(x - 8)2 - 4arrow_forwardIn simplest form and step by step Write the quadratic relation in standard form, then fi nd the zeros. y = 3(x - 1)2 - 147arrow_forward
- Step by step instructions The path of a soccer ball can be modelled by the relation h = - 0.1 d 2 + 0.5 d + 0.6, where h is the ball’s height and d is the horizontal distance from the kicker. a) Find the zeros of the relation.arrow_forwardIn simplest terms and step by step how do you find the zeros of y = 6x2 + 24x - 192arrow_forwardStep by step Find the zeros of each quadratic relation. a) y = x2 - 16xarrow_forward
- In simplest step by step terms, how do you find the zeros of y = x2 - 16arrow_forwardIn simplest terms, Describe the shape and position of the parabola relative to the graph of y = x 2 y = - 80( x + 9) 2 + 10.8arrow_forwardas a Identify each equation Parabola, circle, ellipse perbola without completio the square. x²-6x-14 y = 33-y² 14y ofarrow_forward

 Trigonometry (MindTap Course List)TrigonometryISBN:9781337278461Author:Ron LarsonPublisher:Cengage LearningAlgebra & Trigonometry with Analytic GeometryAlgebraISBN:9781133382119Author:SwokowskiPublisher:Cengage
 Big Ideas Math A Bridge To Success Algebra 1: Stu...AlgebraISBN:9781680331141Author:HOUGHTON MIFFLIN HARCOURTPublisher:Houghton Mifflin Harcourt


