Concept explainers
Videos
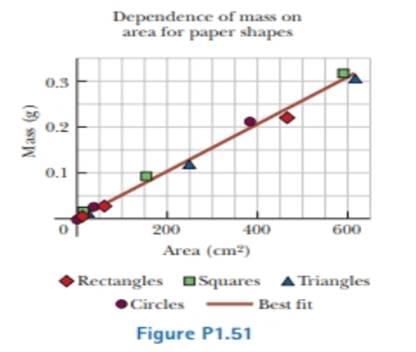
Review. A student is supplied with a stack of copy paper, ruler, compass, scissors, and a sensitive balance. He cuts out various shapes in various sizes, calculates their areas, measures their masses, and prepares the graph of Figure PI.51. (a) Consider the fourth experimental point from the top. How far is it from the best-lit straight line? Express your answer as a difference in vertical-axis coordinate, (b) Express your answer as a percentage, (c) Calculate the slope of the line, (d) State what the graph demonstrates, referring to the shape of the graph and the results of parts (b) and (c). (e) Describe whether this result should be expected theoretically, (f) Describe the physical meaning of the slope.
(a)
The distance of the fourth experimental point from the top from the best –fit straight line.
Answer to Problem 1.51P
The distance of the fourth experimental point from the top from the best fit straight line is
Explanation of Solution
Given data: The student is supplied with a stack of copy paper, ruler, compass, scissors, and a sensitive balance. A graph mass versus area is plotted for different sizes of the paper.
Consider the following figure.
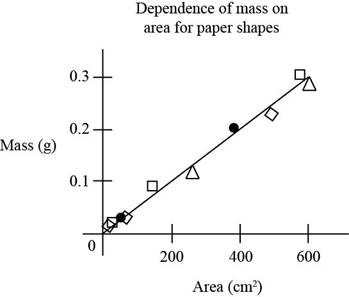
Figure (1)
Figure indicates the graph plotted area of pieces versus mass of the pieces of the paper.
The fourth experimental point from the top is a circle. It lies slightly above the best fit line.
From figure (1), the vertical coordinate for the forth experiment is
So the difference in the vertical axis coordinate is,
Here,
Substitute
Conclusion:
Therefore the distance of the fourth experimental point from the top from the best fit straight line is
(b)
The answer in the form of percentage.
Answer to Problem 1.51P
The answer in the form of percentage is
Explanation of Solution
Given data: The student is supplied with a stack of copy paper, ruler, compass, scissors, and a sensitive balance. A graph mass versus area is plotted for different sizes of the paper.
The expression for the percentage is,
Substitute
Conclusion:
Therefore the answer in the form of percentage is
(c)
The slope of the line.
Answer to Problem 1.51P
The slope of the line is
Explanation of Solution
Given data: The student is supplied with a stack of copy paper, ruler, compass, scissors, and a sensitive balance. A graph mass versus area is plotted for different sizes of the paper.
The expression for the slope is,
Here,
Substitute
Conclusion:
Therefore the slope of the line is
(d)
The demonstration from the graph referring to the shape of the graph and the results of part (b) and (c).
Answer to Problem 1.51P
The graph demonstrates that the mass of the cutout is proportional to its area for the shape cuts from this copy paper and the proportionality constant is
Explanation of Solution
Given data: The student is supplied with a stack of copy paper, ruler, compass, scissors, and a sensitive balance. A graph mass versus area is plotted for different sizes of the paper.
The graph given figure (1) demonstrates that the mass of the cutout in each shape is proportional to its area for the shape cuts from this copy paper and the proportionality constant is
The value of the slope from part (c) of the question and from the part (b) question the percentage uncertainty is
Conclusion:
Therefore the graph demonstrates that the mass of the cutout is proportional to its area for the shape cuts from this copy paper and the proportionality constant is
(e)
Whether this result should be expected theoretically or not.
Answer to Problem 1.51P
This result is to be expected theoretically if the paper has thickness and density that are uniform within the experimental uncertainty.
Explanation of Solution
Given data: The student is supplied with a stack of copy paper, ruler, compass, scissors, and a sensitive balance. A graph mass versus area is plotted for different sizes of the paper.
The graph given figure (1) demonstrates that the mass of the cutout in each shape is proportional to its area for the shape cuts from this copy paper and the proportionality constant is
The value of the slope from part (c) of the question is
Thus this result is expected theoretically when the object is having same aerial mass density and the paper has thickness and density that are uniform within the experimental uncertainty.
Conclusion:
Therefore this result is to be expected theoretically if the paper has thickness and density that are uniform within the experimental uncertainty.
(f)
The physical meaning of the slope.
Answer to Problem 1.51P
The physical meaning of the slope is the aerial density of the paper that represents the mass per unit area.
Explanation of Solution
Given data: The student is supplied with a stack of copy paper, ruler, compass, scissors, and a sensitive balance. A graph mass versus area is plotted for different sizes of the paper.
The graph given figure (1) demonstrates that the mass of the cutout in each shape is proportional to its area for the shape cuts from this copy paper and the proportionality constant is
The value of the slope from part (c) of the question is
The physical meaning of the slope is the aerial density of the paper that represent the mass per unit area.
Conclusion:
Therefore the physical meaning of the slope is the aerial density of the paper that represents the mass per unit area.
Want to see more full solutions like this?
Chapter 1 Solutions
Physics for Scientists and Engineers, Technology Update (No access codes included)
Additional Science Textbook Solutions
Biology: Concepts and Investigations
Applications and Investigations in Earth Science (9th Edition)
Biology: Life on Earth (11th Edition)
Organic Chemistry
Fundamentals Of Thermodynamics
Laboratory Manual For Human Anatomy & Physiology


- 10. Imagine you have a system in which you have 54 grams of ice. You can melt this ice and then vaporize it all at 0 C. The melting and vaporization are done reversibly into a balloon held at a pressure of 0.250 bar. Here are some facts about water you may wish to know. The density of liquid water at 0 C is 1 g/cm³. The density of ice at 0 C is 0.917 g/cm³. The enthalpy of vaporization of liquid water is 2.496 kJ/gram and the enthalpy of fusion of solid water is 333.55 J/gram. A. How much energy does the ice absorb as heat when it melts? B. How much work is involved in melting the ice? C. What is the total change in energy for melting the ice? D. What is the enthalpy change for melting the ice? E. What is the entropy change for melting the ice? F. What is the change in Helmholtz energy for melting the ice? G. What is the change in Gibbs energy for melting the ice?arrow_forwardIn the figure Q = 5.7 nC and all other quantities are accurate to 2 significant figures. What is the magnitude of the force on the charge Q? (k = 1/4πε 0 = 8.99 × 10⁹ N · m2/C2)arrow_forwardNow add a fourth charged particle, particle 3, with positive charge q3, fixed in the yz-plane at (0,d2,d2). What is the net force F→ on particle 0 due solely to this charge? Express your answer (a vector) using k, q0, q3, d2, i^, j^, and k^. Include only the force caused by particle 3.arrow_forward
- For a tornadoes and hurricanes, which of the following is most critical? an alert a watch a warning a predictionarrow_forwardWhen a warm front advances up and over a cold front, what is it called? front inversion stationary front cold front occlusion warm front occlusionarrow_forward1) Consider two positively charged particles, one of charge q0 (particle 0) fixed at the origin, and another of charge q1 (particle 1) fixed on the y-axis at (0,d1,0). What is the net force F→ on particle 0 due to particle 1? Express your answer (a vector) using any or all of k, q0, q1, d1, i^, j^, and k^. 2) Now add a third, negatively charged, particle, whose charge is −q2− (particle 2). Particle 2 fixed on the y-axis at position (0,d2,0). What is the new net force on particle 0, from particle 1 and particle 2? Express your answer (a vector) using any or all of k, q0, q1, q2, d1, d2, i^, j^, and k^. 3) Particle 0 experiences a repulsion from particle 1 and an attraction toward particle 2. For certain values of d1 and d2, the repulsion and attraction should balance each other, resulting in no net force. For what ratio d1/d2 is there no net force on particle 0? Express your answer in terms of any or all of the following variables: k, q0, q1, q2.arrow_forward
- A 85 turn, 10.0 cm diameter coil rotates at an angular velocity of 8.00 rad/s in a 1.35 T field, starting with the normal of the plane of the coil perpendicular to the field. Assume that the positive max emf is reached first. (a) What (in V) is the peak emf? 7.17 V (b) At what time (in s) is the peak emf first reached? 0.196 S (c) At what time (in s) is the emf first at its most negative? 0.589 x s (d) What is the period (in s) of the AC voltage output? 0.785 Sarrow_forwardA bobsled starts at the top of a track as human runners sprint from rest and then jump into the sled. Assume they reach 40 km/h from rest after covering a distance of 50 m over flat ice. a. How much work do they do on themselves and the sled which they are pushing given the fact that there are two men of combined mass 185 kg and the sled with a mass of 200 kg? (If you haven't seen bobsledding, watch youtube to understand better what's going on.) b. After this start, the team races down the track and descends vertically by 200 m. At the finish line the sled crosses with a speed of 55 m/s. How much energy was lost to drag and friction along the way down after the men were in the sled?arrow_forwardFor what type of force is it not possible to define a potential energy expression?arrow_forward
- 10. Imagine you have a system in which you have 54 grams of ice. You can melt this ice and then vaporize it all at 0 C. The melting and vaporization are done reversibly into a balloon held at a pressure of 0.250 bar. Here are some facts about water you may wish to know. The density of liquid water at 0 C is 1 g/cm³. The density of ice at 0 C is 0.917 g/cm³. The enthalpy of vaporization of liquid water is 2.496 kJ/gram and the enthalpy of fusion of solid water is 333.55 J/gram.arrow_forwardConsider 1 mole of supercooled water at -10°C. Calculate the entropy change of the water when the supercooled water freezes at -10°C and 1 atm. Useful data: Cp (ice) = 38 J mol-1 K-1 Cp (water) 75J mol −1 K -1 Afus H (0°C) 6026 J mol −1 Assume Cp (ice) and Cp (water) to be independent of temperature.arrow_forwardThe molar enthalpy of vaporization of benzene at its normal boiling point (80.09°C) is 30.72 kJ/mol. Assuming that AvapH and AvapS stay constant at their values at 80.09°C, calculate the value of AvapG at 75.0°C, 80.09°C, and 85.0°C. Hint: Remember that the liquid and vapor phases will be in equilibrium at the normal boiling point.arrow_forward
 College PhysicsPhysicsISBN:9781305952300Author:Raymond A. Serway, Chris VuillePublisher:Cengage Learning
 University Physics Volume 1PhysicsISBN:9781938168277Author:William Moebs, Samuel J. Ling, Jeff SannyPublisher:OpenStax - Rice University
 Principles of Physics: A Calculus-Based TextPhysicsISBN:9781133104261Author:Raymond A. Serway, John W. JewettPublisher:Cengage Learning
 Physics for Scientists and Engineers: Foundations...PhysicsISBN:9781133939146Author:Katz, Debora M.Publisher:Cengage Learning
 Classical Dynamics of Particles and SystemsPhysicsISBN:9780534408961Author:Stephen T. Thornton, Jerry B. MarionPublisher:Cengage Learning
 Physics for Scientists and EngineersPhysicsISBN:9781337553278Author:Raymond A. Serway, John W. JewettPublisher:Cengage Learning