
Concept explainers
Videos
Facebook Wall Posts (Example 2) A student shared data from the StatCrunch Friend Data Application. Data on gender and number of wall posts for a sample of friends are shown below. (Source: StatCrunch, Facebook Friend Data, posted 2/13/14)
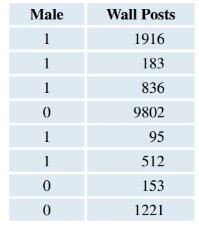
a. Is the format of this data set stacked or unstacked?
b. Explain the coding. What do 1 and 0 represent?
c. If you answered “stacked” in part a, then unstack the data into two columns labeled Male and Female. If you answered “unstacked,” then stack the data into one column and choose a appropriate name for the stacked variable.
Want to see the full answer?
Check out a sample textbook solution
Chapter 1 Solutions
INTRODUCTORY STATISTICS (LOOSELEAF)
Additional Math Textbook Solutions
Math in Our World
Elementary Algebra For College Students (10th Edition)
Algebra and Trigonometry (6th Edition)
Elementary Statistics ( 3rd International Edition ) Isbn:9781260092561
Precalculus: Mathematics for Calculus (Standalone Book)
Elementary Statistics: Picturing the World (7th Edition)


- A company found that the daily sales revenue of its flagship product follows a normal distribution with a mean of $4500 and a standard deviation of $450. The company defines a "high-sales day" that is, any day with sales exceeding $4800. please provide a step by step on how to get the answers in excel Q: What percentage of days can the company expect to have "high-sales days" or sales greater than $4800? Q: What is the sales revenue threshold for the bottom 10% of days? (please note that 10% refers to the probability/area under bell curve towards the lower tail of bell curve) Provide answers in the yellow cellsarrow_forwardFind the critical value for a left-tailed test using the F distribution with a 0.025, degrees of freedom in the numerator=12, and degrees of freedom in the denominator = 50. A portion of the table of critical values of the F-distribution is provided. Click the icon to view the partial table of critical values of the F-distribution. What is the critical value? (Round to two decimal places as needed.)arrow_forwardA retail store manager claims that the average daily sales of the store are $1,500. You aim to test whether the actual average daily sales differ significantly from this claimed value. You can provide your answer by inserting a text box and the answer must include: Null hypothesis, Alternative hypothesis, Show answer (output table/summary table), and Conclusion based on the P value. Showing the calculation is a must. If calculation is missing,so please provide a step by step on the answers Numerical answers in the yellow cellsarrow_forward
 Glencoe Algebra 1, Student Edition, 9780079039897...AlgebraISBN:9780079039897Author:CarterPublisher:McGraw Hill
 Holt Mcdougal Larson Pre-algebra: Student Edition...AlgebraISBN:9780547587776Author:HOLT MCDOUGALPublisher:HOLT MCDOUGAL
 Big Ideas Math A Bridge To Success Algebra 1: Stu...AlgebraISBN:9781680331141Author:HOUGHTON MIFFLIN HARCOURTPublisher:Houghton Mifflin Harcourt