What is the relationship between the amount of time statistics students study per week and their final exam scores? The results of the survey are shown below. Time 11 7 1 2 1 7 4 Score 82 68 70 63 62 54 78 69 x-values y-values a. Find the correlation coefficient: r = Round to 2 decimal places. b. The null and alternative hypotheses for correlation are: Ho: ? v = H1: ?v + 0 G. The n-yalue is: (Round to four decimal places)
What is the relationship between the amount of time statistics students study per week and their final exam scores? The results of the survey are shown below. Time 11 7 1 2 1 7 4 Score 82 68 70 63 62 54 78 69 x-values y-values a. Find the correlation coefficient: r = Round to 2 decimal places. b. The null and alternative hypotheses for correlation are: Ho: ? v = H1: ?v + 0 G. The n-yalue is: (Round to four decimal places)

A First Course in Probability (10th Edition)
10th Edition
ISBN:9780134753119
Author:Sheldon Ross
Publisher:Sheldon Ross
Chapter1: Combinatorial Analysis
Section: Chapter Questions
Problem 1.1P: a. How many different 7-place license plates are possible if the first 2 places are for letters and...

Related questions
Question

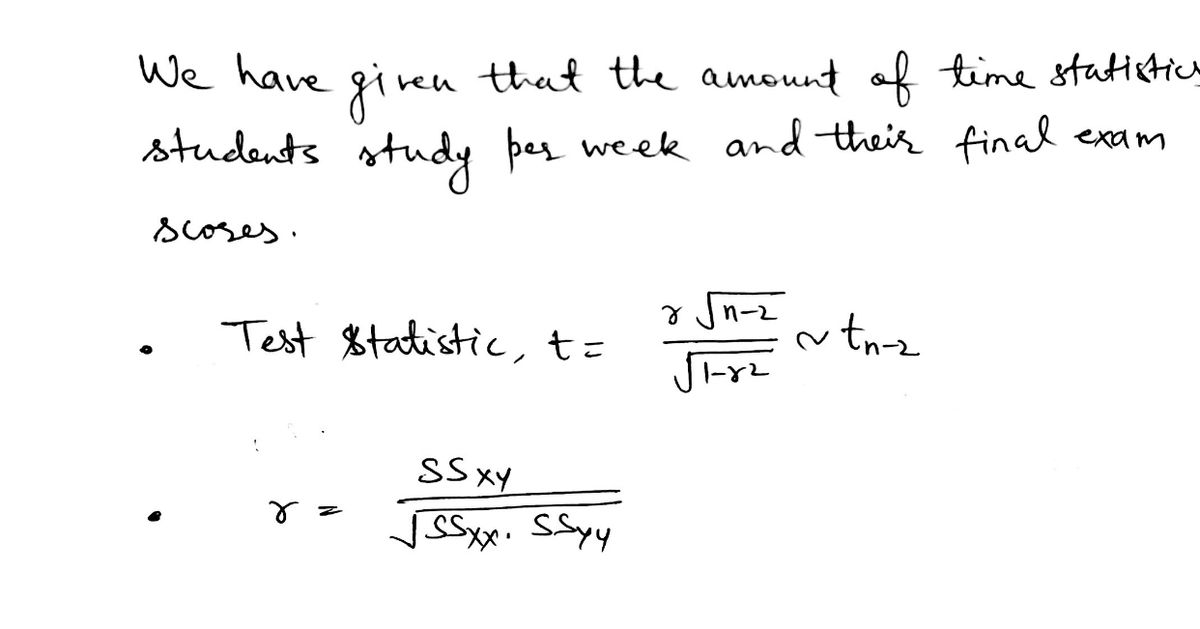
Transcribed Image Text:**Exploring the Relationship Between Study Time and Exam Scores**
In a survey conducted to study the relationship between the amount of time statistics students spend studying per week and their final exam scores, the following data was collected:
| Time (hours) | 11 | 5 | 7 | 1 | 2 | 1 | 7 | 4 |
|--------------|----|---|---|---|---|---|---|---|
| Score | 82 | 68| 70| 63| 62| 54| 78| 69|
To analyze the data, we need to consider the following steps:
- **x-values** represent the time students spent studying each week.
- **y-values** represent the scores obtained by these students in their final exams.
**a. Correlation Coefficient:**
Determine the correlation coefficient, \( r \), which measures the strength and direction of the linear relationship between the two variables. Calculate \( r \) and round the answer to 2 decimal places.
**b. Hypotheses for Correlation:**
Set up the null and alternative hypotheses for testing the correlation:
- \( H_0: \rho = 0 \) (No correlation between study time and scores)
- \( H_1: \rho \neq 0 \) (There is a correlation)
**c. P-value:**
Calculate the p-value, which indicates the probability of observing the data if the null hypothesis is true. Record the p-value, rounded to four decimal places.
This analysis will help determine if there is a statistically significant relationship between the time spent studying and the exam scores among the surveyed students.
Expert Solution
Step 1

Step by step
Solved in 3 steps with 3 images

Recommended textbooks for you
A First Course in Probability (10th Edition)
Probability
ISBN:
9780134753119
Author:
Sheldon Ross
Publisher:
PEARSON

A First Course in Probability (10th Edition)
Probability
ISBN:
9780134753119
Author:
Sheldon Ross
Publisher:
PEARSON