A,D,F,G

MATLAB: An Introduction with Applications
6th Edition
ISBN:9781119256830
Author:Amos Gilat
Publisher:Amos Gilat
Chapter1: Starting With Matlab
Section: Chapter Questions
Problem 1P
icon
Related questions
Question

PLEASE HELP WITH A,D,F,G 

What is the relationship between the number of minutes per day a
woman spends talking on the phone and the woman's weight? The
time on the phone and weight for 8 women are shown in the table
below.
Time
31 39
32
74
57
11
41
22
Pounds
106 108 104 148
120 91 137 110
a. Find the correlation coefficient:
Round to 2
decimal places.
b. The null and alternative hypotheses for correlation are:
Ho: P = 0
H1: P
+ 0 o o
The p-value is:
(Round to four decimal places)
c. Use a level of significance of a = 0.05 to state the conclusion of
the hypothesis test in the context of the study.
OThere is statistically significant evidence to conclude that
a woman who spends more time on the phone will weigh
more than a woman who spends less time on the phone.
O There is statistically significant evidence to conclude that
there is a correlation between the time women spend on
the phone and their weight. Thus, the regression line is
useful.
OThere is statistically insignificant evidence to conclude
that a woman who spends more time on the phone will
weigh more than a woman who spends less time on the
phone.
OThere is statistically insignificant evidence to conclude
that there is a correlation between the time women spend
on the phone and their weight. Thus, the use of the
regression line is not appropriate.
of
d. =
(Round to two decimal places)
e. Interpret ² :
OGiven any group of women who all weight the same
amount, 72% of all of these women will weigh the
predicted amount.
O There is a large variation in women's weight, but if you
only look at women with a fixed time on the phone , this
variation on average is reduced by 72%.
OThere is a 72% chance that the regression line will be a
good predictor for women's weight based on their time
spent on the phone.
072% of all women will have the average weight.
f. The equation of the linear regression line is:
(Please show your answers to two
decimal places)
g. Use the model to predict the weight of a woman who spends 50
minutes on the phone.
Weight =
whole number.)
(Please round your answer to the nearest
h. Interpret the slope of the regression line in the context of the
question:
O The slope has no practical meaning since you cannot
predict a women's weight.
O For every additional minute women spend on the phone,
they tend to weigh on averge 0.80 additional pounds.
OAs x goes up, y goes up.
i. Interpret the y-intercept in the context of the question:
OThe y-intercept has no practical meaning for this study.
O If a woman does not spend any time talking on the phone,
then that woman will weigh 85 pounds.
O The best prediction for the weight of a woman who does
not spend any time talking on the phone is 85 pounds.
OThe average woman's weight is predicted to be 85.
Transcribed Image Text:What is the relationship between the number of minutes per day a woman spends talking on the phone and the woman's weight? The time on the phone and weight for 8 women are shown in the table below. Time 31 39 32 74 57 11 41 22 Pounds 106 108 104 148 120 91 137 110 a. Find the correlation coefficient: Round to 2 decimal places. b. The null and alternative hypotheses for correlation are: Ho: P = 0 H1: P + 0 o o The p-value is: (Round to four decimal places) c. Use a level of significance of a = 0.05 to state the conclusion of the hypothesis test in the context of the study. OThere is statistically significant evidence to conclude that a woman who spends more time on the phone will weigh more than a woman who spends less time on the phone. O There is statistically significant evidence to conclude that there is a correlation between the time women spend on the phone and their weight. Thus, the regression line is useful. OThere is statistically insignificant evidence to conclude that a woman who spends more time on the phone will weigh more than a woman who spends less time on the phone. OThere is statistically insignificant evidence to conclude that there is a correlation between the time women spend on the phone and their weight. Thus, the use of the regression line is not appropriate. of d. = (Round to two decimal places) e. Interpret ² : OGiven any group of women who all weight the same amount, 72% of all of these women will weigh the predicted amount. O There is a large variation in women's weight, but if you only look at women with a fixed time on the phone , this variation on average is reduced by 72%. OThere is a 72% chance that the regression line will be a good predictor for women's weight based on their time spent on the phone. 072% of all women will have the average weight. f. The equation of the linear regression line is: (Please show your answers to two decimal places) g. Use the model to predict the weight of a woman who spends 50 minutes on the phone. Weight = whole number.) (Please round your answer to the nearest h. Interpret the slope of the regression line in the context of the question: O The slope has no practical meaning since you cannot predict a women's weight. O For every additional minute women spend on the phone, they tend to weigh on averge 0.80 additional pounds. OAs x goes up, y goes up. i. Interpret the y-intercept in the context of the question: OThe y-intercept has no practical meaning for this study. O If a woman does not spend any time talking on the phone, then that woman will weigh 85 pounds. O The best prediction for the weight of a woman who does not spend any time talking on the phone is 85 pounds. OThe average woman's weight is predicted to be 85.
Expert Solution
Step 1

a.

The correlation value is obtained using EXCEL. The software procedure is given below:

  • Enter the data.
  • Select Data > Data Analysis >Correlation> OK.
  • Enter Input Range as A1:B9 for variables Time and Pounds.
  • Mark Labels in First Row.
  • Click OK.

The output using EXCEL is as follows:

Statistics homework question answer, step 1, image 1

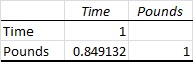
From the output, the correlation coefficient r is 0.85.

Thus, the correlation coefficient (r) is 0.85.

steps

Step by step

Solved in 2 steps with 2 images

Blurred answer
Knowledge Booster
Functions and Inverse Functions
Learn more about
Need a deep-dive on the concept behind this application? Look no further. Learn more about this topic, statistics and related others by exploring similar questions and additional content below.
Recommended textbooks for you
MATLAB: An Introduction with Applications
Statistics
ISBN:
9781119256830
Author:
Amos Gilat
Publisher:
John Wiley & Sons Inc
Probability and Statistics for Engineering and th…
Statistics
ISBN:
9781305251809
Author:
Jay L. Devore
Publisher:
Cengage Learning
Statistics for The Behavioral Sciences (MindTap C…
Statistics
ISBN:
9781305504912
Author:
Frederick J Gravetter, Larry B. Wallnau
Publisher:
Cengage Learning
Elementary Statistics: Picturing the World (7th E…
Statistics
ISBN:
9780134683416
Author:
Ron Larson, Betsy Farber
Publisher:
PEARSON
The Basic Practice of Statistics
Statistics
ISBN:
9781319042578
Author:
David S. Moore, William I. Notz, Michael A. Fligner
Publisher:
W. H. Freeman
Introduction to the Practice of Statistics
Statistics
ISBN:
9781319013387
Author:
David S. Moore, George P. McCabe, Bruce A. Craig
Publisher:
W. H. Freeman