ICA 7-A Spooled t test 4 individuals were tested in the Memory test in the congruent condition & another 4 individuals were tested in the incongruent condition. Is there a difference between conditions? What is the 95% confidence interval of the mean difference? What is the effect size? [(n₁ − 1)Ŝ² + (n₂ − 1)Ŝ²] (n-1)+(₂-1) d = Mx-My Subject S pooled 1 2 3 4 5 6 7 8 S=₁ Ŝp Total Score (X) 10 6 9 3 20 12 15 9 Σ(X-M)² (N-1) Σ(X-M)² (N-1) Group 1 1 1 1 2 t== 2 2 2 X-X₂ ST X1-X₂ [(n, − 1) S² + (n₂ − 1)§² ( 1 +
ICA 7-A Spooled t test 4 individuals were tested in the Memory test in the congruent condition & another 4 individuals were tested in the incongruent condition. Is there a difference between conditions? What is the 95% confidence interval of the mean difference? What is the effect size? [(n₁ − 1)Ŝ² + (n₂ − 1)Ŝ²] (n-1)+(₂-1) d = Mx-My Subject S pooled 1 2 3 4 5 6 7 8 S=₁ Ŝp Total Score (X) 10 6 9 3 20 12 15 9 Σ(X-M)² (N-1) Σ(X-M)² (N-1) Group 1 1 1 1 2 t== 2 2 2 X-X₂ ST X1-X₂ [(n, − 1) S² + (n₂ − 1)§² ( 1 +

MATLAB: An Introduction with Applications
6th Edition
ISBN:9781119256830
Author:Amos Gilat
Publisher:Amos Gilat
Chapter1: Starting With Matlab
Section: Chapter Questions
Problem 1P

Related questions
Question
![**Title: T-Test Analysis**
**Overview of Study:**
- **Objective:** To determine if there is a difference between two conditions using a t-test.
- **Participants:** 8 individuals divided into two groups:
- Group 1 (Congruent condition)
- Group 2 (Incongruent condition)
**Data Collected:**
| Subject | Total Score (X) | Group |
|---------|----------------|-------|
| 1 | 10 | 1 |
| 2 | 6 | 1 |
| 3 | 9 | 1 |
| 4 | 3 | 1 |
| 5 | 20 | 2 |
| 6 | 12 | 2 |
| 7 | 15 | 2 |
| 8 | 9 | 2 |
**Research Questions:**
1. Is there a difference between conditions?
2. What is the 95% confidence interval of the mean difference?
3. What is the effect size?
**Statistical Analysis:**
1. **Standard Deviation (s):**
\[
s = \sqrt{\frac{\sum (X - M)^2}{N-1}}
\]
2. **T-statistic (t):**
\[
t = \frac{\overline{X}_1 - \overline{X}_2}{\hat{S}_{\overline{X}_1 - \overline{X}_2}}
\]
3. **Pooled Standard Deviation (\(\hat{S}_{\text{pooled}}\)):**
\[
\hat{S}_{\text{pooled}} = \sqrt{\frac{(n_1 - 1)\hat{S}_1^2 + (n_2 - 1)\hat{S}_2^2}{(n_1 - 1) + (n_2 - 1)}}
\]
4. **Effect Size (d):**
\[
d = \frac{M_X - M_Y}{S_{\text{pooled}}}
\]
**Confidence Interval (CI) Formula:**
\[
CI = \text{Mean Difference} \pm t_{\text{critical}}(\hat{S}_{\overline{X](/v2/_next/image?url=https%3A%2F%2Fcontent.bartleby.com%2Fqna-images%2Fquestion%2F1ffb0219-9c91-4db5-8eec-6f48496f58b1%2Ffbfc47ca-ad2d-48bc-8471-f92466a744ff%2Fwqouba_processed.jpeg&w=3840&q=75)
Transcribed Image Text:**Title: T-Test Analysis**
**Overview of Study:**
- **Objective:** To determine if there is a difference between two conditions using a t-test.
- **Participants:** 8 individuals divided into two groups:
- Group 1 (Congruent condition)
- Group 2 (Incongruent condition)
**Data Collected:**
| Subject | Total Score (X) | Group |
|---------|----------------|-------|
| 1 | 10 | 1 |
| 2 | 6 | 1 |
| 3 | 9 | 1 |
| 4 | 3 | 1 |
| 5 | 20 | 2 |
| 6 | 12 | 2 |
| 7 | 15 | 2 |
| 8 | 9 | 2 |
**Research Questions:**
1. Is there a difference between conditions?
2. What is the 95% confidence interval of the mean difference?
3. What is the effect size?
**Statistical Analysis:**
1. **Standard Deviation (s):**
\[
s = \sqrt{\frac{\sum (X - M)^2}{N-1}}
\]
2. **T-statistic (t):**
\[
t = \frac{\overline{X}_1 - \overline{X}_2}{\hat{S}_{\overline{X}_1 - \overline{X}_2}}
\]
3. **Pooled Standard Deviation (\(\hat{S}_{\text{pooled}}\)):**
\[
\hat{S}_{\text{pooled}} = \sqrt{\frac{(n_1 - 1)\hat{S}_1^2 + (n_2 - 1)\hat{S}_2^2}{(n_1 - 1) + (n_2 - 1)}}
\]
4. **Effect Size (d):**
\[
d = \frac{M_X - M_Y}{S_{\text{pooled}}}
\]
**Confidence Interval (CI) Formula:**
\[
CI = \text{Mean Difference} \pm t_{\text{critical}}(\hat{S}_{\overline{X
Expert Solution
Step 1
Given Information:
4 individuals were tested in the Memory test in the congruent condition.
Another 4 individuals were tested in the incongruent condition.
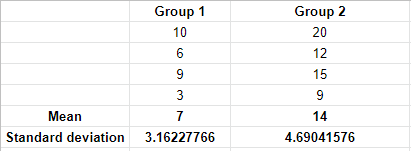
The data is:
| Group 1 | Group 2 |
| 10 | 20 |
| 6 | 12 |
| 9 | 15 |
| 3 | 9 |
Enter the data in Excel. Use the Excel function "=AVERAGE()" to obtain the sample mean for each group.
Use the function "=STDEV.S()" to obtain the sample standard deviation for each group.

Trending now
This is a popular solution!

Step by step
Solved in 3 steps with 2 images

Follow-up Questions
Read through expert solutions to related follow-up questions below.
Recommended textbooks for you
MATLAB: An Introduction with Applications
Statistics
ISBN:
9781119256830
Author:
Amos Gilat
Publisher:
John Wiley & Sons Inc

Probability and Statistics for Engineering and th…
Statistics
ISBN:
9781305251809
Author:
Jay L. Devore
Publisher:
Cengage Learning

Statistics for The Behavioral Sciences (MindTap C…
Statistics
ISBN:
9781305504912
Author:
Frederick J Gravetter, Larry B. Wallnau
Publisher:
Cengage Learning
MATLAB: An Introduction with Applications
Statistics
ISBN:
9781119256830
Author:
Amos Gilat
Publisher:
John Wiley & Sons Inc
Probability and Statistics for Engineering and th…
Statistics
ISBN:
9781305251809
Author:
Jay L. Devore
Publisher:
Cengage Learning
Statistics for The Behavioral Sciences (MindTap C…
Statistics
ISBN:
9781305504912
Author:
Frederick J Gravetter, Larry B. Wallnau
Publisher:
Cengage Learning

Elementary Statistics: Picturing the World (7th E…
Statistics
ISBN:
9780134683416
Author:
Ron Larson, Betsy Farber
Publisher:
PEARSON

The Basic Practice of Statistics
Statistics
ISBN:
9781319042578
Author:
David S. Moore, William I. Notz, Michael A. Fligner
Publisher:
W. H. Freeman

Introduction to the Practice of Statistics
Statistics
ISBN:
9781319013387
Author:
David S. Moore, George P. McCabe, Bruce A. Craig
Publisher:
W. H. Freeman