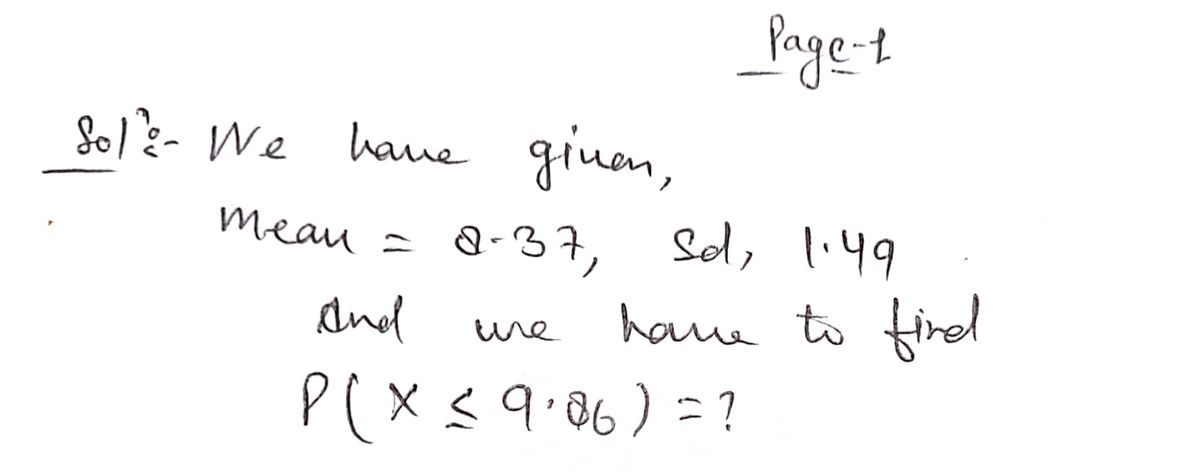
Suppose that Shoe Sices Of American women have a bell Shaped clistribution, with a mean of 8,37 and a Standard eleviation of 1.49, using the empirical Rule what percentage of american women have Shoe Sizes that are no more than 9.su? do not Roundl your answer
Q: proportion of only children in the special program is significantly different from the proportion to…
A: Given : Claim : The proportion of only children in the special program is significantly different…
Q: Mathew determines that the “power” for detecting a posttest score of the size Mathew expects with…
A: Power: The probability of rejecting the null hypothesis, assuming that the null hypothesis is false.…
Q: distributed with a mean of 47 hours. A newly hired engineer at a start-up company believes that…
A: NOTE:- According to bartleby guidelines expert can solve maximum three subpart of a question and…
Q: The data is healing time for each treatment A,B, and P 1. Does the treatment have an effect on the…
A: Hypothesis testing is the claim that is tested by the statistical test.There are four treatments…
Q: What are the correct hypotheses? H0: Correct Correct hours H1: Correct…
A: We want to find null hypothesis, alternate hypothesis, test statistics and P-value
Q: A group of students estimated the length of one minute without reference to a watch or clock, and…
A: Given data represent a group of students estimated the length of one minute without reference to a…
Q: Now you wonder - which height groups differ significantly in their job satisfaction. Re-run your…
A: ANOVA stands for analysis of variance. It is used to compare the means of more than two groups. This…
Q: Using the dotplot and the difference in mean distances from the samples, is there convincing…
A: Given that; The difference in mean distances travelled (new - original) for the samples was 2.6.…
Q: The work week for adults in the US that work full time is normally distributed with a mean of 47…
A: Denote μ as the population mean working hours.
Q: 's claim at 5% significance that less than two-thirds (67%) of U.S. adults thought that keep the…
A:
Q: What values are used in a repeated measures t-test
A: Repeated measures t-test description
Q: 5) A researcher is testing the claim that the mean weight of a population of women is less than 120…
A: here as PER GUIDELINES I HAVE CALCULATED FIRST QUESTION , PLZ REPOST FOR REMAINING here given ,…
Q: A data set includes data from student evaluations of courses. The summary statistics are n= 93, x=…
A: State the hypotheses. Correct option: Option A
Q: The work week for adults in the US that work full time is normally distributed with a mean of 47…
A: State the hypotheses. That is, there is no evidence to conclude that the employees at start-up…
Q: 41. Refer to the following data, and choose the correct conclusion T-tests were done on the means to…
A: Given that, t-stat t-crit FF1 VS FF2 -1.02776 2.364624 FF1 VS FF3 3.552703 2.446912 FF2…
Q: Suppose that we are testing ?0:?=0.3 vs ??:? < 0.3. We found a test statistic of -2.135. a) Find…
A: Given that: H0:p=0.3 H1:p<0.3 The test statistic is -2.135
Q: The average American gets a haircut every 42 days. Is the average larger for college students? The…
A:
Q: You are performing a chi-square test involving 7 categories. Your Null hypothesis is "All…
A: Suppose we are performing a chi-square test involving 7 categories. And our null hypothesis is “All…
Q: The work week for adults in the US that work full time is normally distributed with a mean of 47…
A: Introduction: Denote μ as the true mean time worked by an employee at start-up companies, in a work…
Q: The work week for adults in the US that work full time is normally distributed with a mean of 47…
A:
Q: The work week for adults in the US that work full time is normally distributed with a mean of 47…
A: Solution: n= 12 Sample size μ=47 Population Mean ∑x=622x=∑xn=62212=51.8333 Sample…
Q: The work week for adults in the US that work full time is normally distributed with a mean of 47…
A: Solution: Since the test is about mean the symbol should be used is µ. State the hypotheses. Null…
Q: The work week for adults in the US that work full time is normally distributed with a mean of 47…
A: We have given that data Population mean mu= 47 Level of significance =alpha = 0.01 Sample size…
Q: A home improvement company is interested in improving customer satisfaction rate from the 80%…
A: Given data number of success , x= 138.0 sample size, n = 164 population…
Q: The work week for adults in the US that work full time is normally distributed with a mean of 47…
A: Answer Given,The level of significance = 1% = 0.01The sample size [n] = 12
Q: A sample of n = 100 people is classified into four categories. If the results are evaluated with a…
A: We know that Degree of freedom =No. of class -No. of condition. Since there will be only one…
Q: The work week for adults in the US that work full time is normally distributed with a mean of 47…
A:
Q: The work week for adults in the US that work full time is normally distributed with a mean of 47…
A: Statistical hypothesis testing is an important method in inferential statistics. It is used to test…
Q: At α=0.05, can you conclude that at least one mean vacuum cleaner weight is different from the…
A:
Q: he work week for adults in the US that work full time is normally distributed with a mean of 47…
A: The formula for the t test statistic is, t=x¯-μsnμ is the population means is the sample standard…
Q: Each person in random samples of 217 male and 273 female working adults living in a certain town in…
A: The hypothesis is, Null hypothesis: H0:μmales-μfemales=0 Alternative hypothesis:…
Q: Do female college students spend more time thán male college students watching TV? This was one of…
A: Given: For males: MeanXmales¯=68.3Standard deviationsmales=67.5n1: no. of male students surveyed=46…
Q: The work week for adults in the US that work full time is normally distributed with a mean of 47…
A:
Q: A random sample of 15 families representing three different Scandinavian countries has been observed…
A: Given: Sweden Norway Denmark 10 11 7 9 10 5 4 5 2 2 2 0
Q: The work week for adults in the US that work full time is normally distributed with a mean of 47…
A:
Q: The work week for adults in the US that work full time is normally distributed with a mean of 47…
A: Step 1:Given:Sample size, n = 12Data454951554768465545495351Step 2:Goal:State the Null and…
Q: The work week for adults in the US that work full time is normally distributed with a mean of 47…
A: Given that X denotes the number of hours US adults work The population mean =47 hours X follows…
Q: The average annual miles driven per vehicle in the United States is 11.1 thousand miles, with o =…
A:
Step by step
Solved in 2 steps with 2 images
- Find the value of the test statistic z using z =The claim is that the proportion of drowning deaths of children attributable to beaches is more than 0.25, and the sample statistics include n = 681 drowning deaths ofchildren with 30% of them attributable to beaches.2.853.01P-PPqn2.856.Findthevalueoftheteststatisticzusingz=Theclaimisthattheproportionofdrowningdeathsofchildrenattributabletobeachesismorethan0.25,andthesamplestatisticsincluden=681drowningdeathsofchildrenwith30%ofthemattributabletobeaches.2.853.01P-PPqn2.85The average American gets a haircut every 43 days. Is the average larger for college students? The data below shows the results of a survey of 11 college students asking them how many days elapse between haircuts. Assume that the distribution of the population is normal. 38, 37, 38, 45, 53, 55, 35, 37, 35, 41, 38 What can be concluded at the the α = 0.05 level of significance level of significance? For this study, we should use? Select an answer: t-test for a population mean? z-test for a population mean? The null and alternative hypotheses would be: H0:H0? p or μ Select an answer > = ≠ ≤ < ≥ H1:H1? μ or p Select an answer ≠ ≥ > ≤ = < 2. The test statistic ? t z = (please show your answer to 3 decimal places.) The p-value = _______ (Please show your answer to 3 decimal places.) The p-value is? > or ≤ α 3. Based on this, we should?? Select an answer reject ? accept ? or fail to reject ?…A group of students estimated the length of one minute without reference to a watch or clock, and the times (seconds) are listed below. Use a 0.05 significance level to test the claim that these times are from a population with a mean equal to 60 seconds. Does it appear that students are reasonably good at estimating one minute? 66, 79, 39, 65, 41, 26, 58, 62, 68, 47, 63 73, 91, 87, 68. 1. Determine the test statistic 2. P-value 3. State the final conclusion that addresses the original claim.
- The work week for adults in the US that work full time is normally distributed with a mean of 47 hours. A newly hired engineer at a start-up company believes that employees at start-up companies work more on average then most working adults in the US. She asks 12 engineering friends at start-ups for the lengths in hours of their work week. Their responses are shown in the table below. Test the claim using a 5% level of significance. Give answer to at least 4 decimal places. Hours 46 49 58 55 49 68 45 48 46 45 51 50 What are the correct hypotheses? H0: hoursH1: hours Based on the hypotheses, find the following:Test Statistic=p-value= The correct decision is to . The correct summary would be: that the mean number of hours of all employees at start-up companies work more than the US mean of 47 hours.Below indicate whether the appropriate test would be an independent t-test, dependent t-test, One-way ANOVA, or z-test. A researcher wants to know if people find baby animals cuter than adult animals. All of the participants in a study are shown 10 pictures of baby animals and 10 pictures of adult animals. They are asked to rate (on a 1 to 10 scale) how cute they think each animal is.The work week for adults in the US that work full time is normally distributed with a mean of 47 hours. A newly hired engineer at a start-up company believes that employees at start-up companies work more on average then most working adults in the US. She asks 12 engineering friends at start-ups for the lengths in hours of their work week. Their responses are shown in the table below. Test the claim using a 10% level of significance. Give answer to at least 4 decimal places. Hours 49 40 58 52 49 70 49 59 47 49 53 55 What are the correct hypotheses? H0: hoursH1: hours Based on the hypotheses, find the following:Test Statistic=p-value= The correct decision is to . The correct summary would be: that the mean number of hours of all employees at start-up companies work more than the US mean of 47 hours.
- Please helpYou want to compare differences in prior arrests across ethnicity in your study, you measured ethnicity as white =0 black =1 hispanic=2, and other =3. Prior arrests was recorded as the number of prior arrests. which test would you perform to see if arrests differ across diffrent ethnic categories? A. ANOVA B. T-testGenerally speaking, would you say that most people can be trusted? A random sample of n. 258 people in Chicago ages 18-25 showed that r₁-40 said yes. Another random sample of n₂ = 287 people in Chicago ages 35-45 showed that r₂- 69 said yes. Does this indicate that the population proportion of trusting people in Chicago is higher for the older group? Use a = 0.05. LAUSE SALT (a) What is the level of significance? State the null and alternate hypotheses. O Ho: P₁ P₂i H₂: P₁ P₂ P₂ H₁: Pg P₂ P₂i H₂i PqThe work week for adults in the US that work full time is normally distributed with a mean of 47 hours. A newly hired engineer at a start-up company believes that employees at start-up companies work more on average then most working adults in the US. She asks 12 engineering friends at start-ups for the lengths in hours of their work week. Their responses are shown in the table below. Test the claim using a 1% level of significance. Give answer to at least 4 decimal places. Hours 45 50 60 50 48 61 54 49 50 48 55 50 (a) Determine the null and alternative hypotheses? Họ: Select an answer v hours H1: Select an answer hours (b) Determine the test statistic ? (c) Determine the p-value. p-value = (d) Make a decision. O Accept the alternative hypotheis Accept the null hypothesis Do not reject the null hypothesis O Reject the null hypothesisThe work week for adults in the US that work full time is normally distributed with a mean of 47 hours. A newly hired engineer at a start-up company believes that employees at start-up companies work more on average then most working adults in the US. She asks 12 engineering friends at start-ups for the lengths in hours of their work week. Their responses are shown in the table below. Test the claim using a 10% level of significance. Give answer to at least 4 decimal places. Hours 48 43 58 51 45 62 47 55 49 49 52 53 a. What are the correct hypotheses? Ho: Select an answer H₁: Select an answer b. Test Statistic = Based on the hypotheses, find the following: c. p-value = ? 0 ? 0 d. The correct decision is to Select an answer Add Work hours hours e. The correct summary would be: Select an answer hours of all employees at start-up companies work more than the US mean of 47 hours. that the mean number ofWhat is the P-value? Make a final conclusionSEE MORE QUESTIONS